Cambodian vs Immigrants from Micronesia Median Family Income
COMPARE
Cambodian
Immigrants from Micronesia
Median Family Income
Median Family Income Comparison
Cambodians
Immigrants from Micronesia
$117,780
MEDIAN FAMILY INCOME
100.0/ 100
METRIC RATING
44th/ 347
METRIC RANK
$90,345
MEDIAN FAMILY INCOME
0.2/ 100
METRIC RATING
273rd/ 347
METRIC RANK
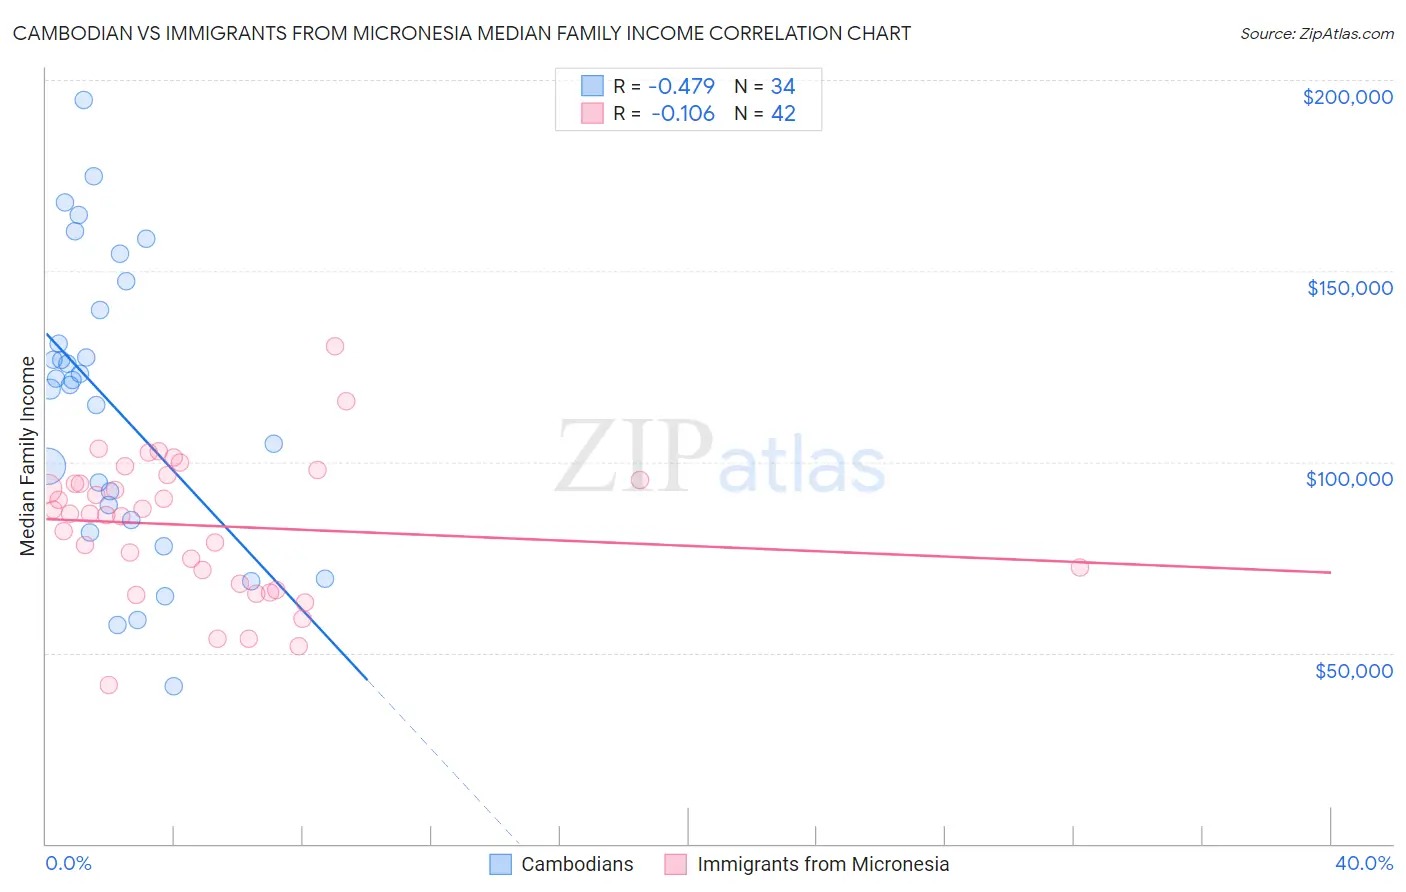
Cambodian vs Immigrants from Micronesia Median Family Income Correlation Chart
The statistical analysis conducted on geographies consisting of 102,461,045 people shows a moderate negative correlation between the proportion of Cambodians and median family income in the United States with a correlation coefficient (R) of -0.479 and weighted average of $117,780. Similarly, the statistical analysis conducted on geographies consisting of 61,597,595 people shows a poor negative correlation between the proportion of Immigrants from Micronesia and median family income in the United States with a correlation coefficient (R) of -0.106 and weighted average of $90,345, a difference of 30.4%.
Median Family Income Correlation Summary
| Measurement | Cambodian | Immigrants from Micronesia |
| Minimum | $41,250 | $41,563 |
| Maximum | $194,752 | $130,417 |
| Range | $153,502 | $88,854 |
| Mean | $114,811 | $83,297 |
| Median | $120,749 | $86,500 |
| Interquartile 25% (IQ1) | $84,853 | $68,241 |
| Interquartile 75% (IQ3) | $139,722 | $95,313 |
| Interquartile Range (IQR) | $54,869 | $27,072 |
| Standard Deviation (Sample) | $37,903 | $18,370 |
| Standard Deviation (Population) | $37,342 | $18,150 |
Similar Demographics by Median Family Income
Demographics Similar to Cambodians by Median Family Income
In terms of median family income, the demographic groups most similar to Cambodians are Bulgarian ($117,818, a difference of 0.030%), Immigrants from Bolivia ($117,912, a difference of 0.11%), Estonian ($118,013, a difference of 0.20%), Immigrants from Lithuania ($118,053, a difference of 0.23%), and Immigrants from Greece ($117,344, a difference of 0.37%).
| Demographics | Rating | Rank | Median Family Income |
| Australians | 100.0 /100 | #37 | Exceptional $118,440 |
| Immigrants | Turkey | 100.0 /100 | #38 | Exceptional $118,325 |
| Immigrants | Asia | 100.0 /100 | #39 | Exceptional $118,291 |
| Immigrants | Lithuania | 100.0 /100 | #40 | Exceptional $118,053 |
| Estonians | 100.0 /100 | #41 | Exceptional $118,013 |
| Immigrants | Bolivia | 100.0 /100 | #42 | Exceptional $117,912 |
| Bulgarians | 100.0 /100 | #43 | Exceptional $117,818 |
| Cambodians | 100.0 /100 | #44 | Exceptional $117,780 |
| Immigrants | Greece | 99.9 /100 | #45 | Exceptional $117,344 |
| Immigrants | Russia | 99.9 /100 | #46 | Exceptional $116,942 |
| Immigrants | Austria | 99.9 /100 | #47 | Exceptional $116,830 |
| Immigrants | South Africa | 99.9 /100 | #48 | Exceptional $116,286 |
| Chinese | 99.9 /100 | #49 | Exceptional $116,188 |
| Immigrants | Czechoslovakia | 99.9 /100 | #50 | Exceptional $116,165 |
| Immigrants | Malaysia | 99.9 /100 | #51 | Exceptional $115,880 |
Demographics Similar to Immigrants from Micronesia by Median Family Income
In terms of median family income, the demographic groups most similar to Immigrants from Micronesia are Spanish American ($90,322, a difference of 0.020%), Immigrants from Liberia ($90,450, a difference of 0.12%), Iroquois ($90,543, a difference of 0.22%), Jamaican ($90,581, a difference of 0.26%), and Immigrants from St. Vincent and the Grenadines ($90,094, a difference of 0.28%).
| Demographics | Rating | Rank | Median Family Income |
| Central Americans | 0.3 /100 | #266 | Tragic $91,087 |
| Mexican American Indians | 0.2 /100 | #267 | Tragic $90,918 |
| Cree | 0.2 /100 | #268 | Tragic $90,882 |
| Belizeans | 0.2 /100 | #269 | Tragic $90,880 |
| Jamaicans | 0.2 /100 | #270 | Tragic $90,581 |
| Iroquois | 0.2 /100 | #271 | Tragic $90,543 |
| Immigrants | Liberia | 0.2 /100 | #272 | Tragic $90,450 |
| Immigrants | Micronesia | 0.2 /100 | #273 | Tragic $90,345 |
| Spanish Americans | 0.2 /100 | #274 | Tragic $90,322 |
| Immigrants | St. Vincent and the Grenadines | 0.2 /100 | #275 | Tragic $90,094 |
| Immigrants | Zaire | 0.1 /100 | #276 | Tragic $89,285 |
| Immigrants | Jamaica | 0.1 /100 | #277 | Tragic $89,268 |
| Immigrants | Grenada | 0.1 /100 | #278 | Tragic $89,249 |
| Immigrants | Belize | 0.1 /100 | #279 | Tragic $89,197 |
| British West Indians | 0.1 /100 | #280 | Tragic $88,987 |