Tsimshian vs Immigrants from Barbados Median Family Income
COMPARE
Tsimshian
Immigrants from Barbados
Median Family Income
Median Family Income Comparison
Tsimshian
Immigrants from Barbados
$101,543
MEDIAN FAMILY INCOME
35.9/ 100
METRIC RATING
182nd/ 347
METRIC RANK
$92,419
MEDIAN FAMILY INCOME
0.5/ 100
METRIC RATING
254th/ 347
METRIC RANK
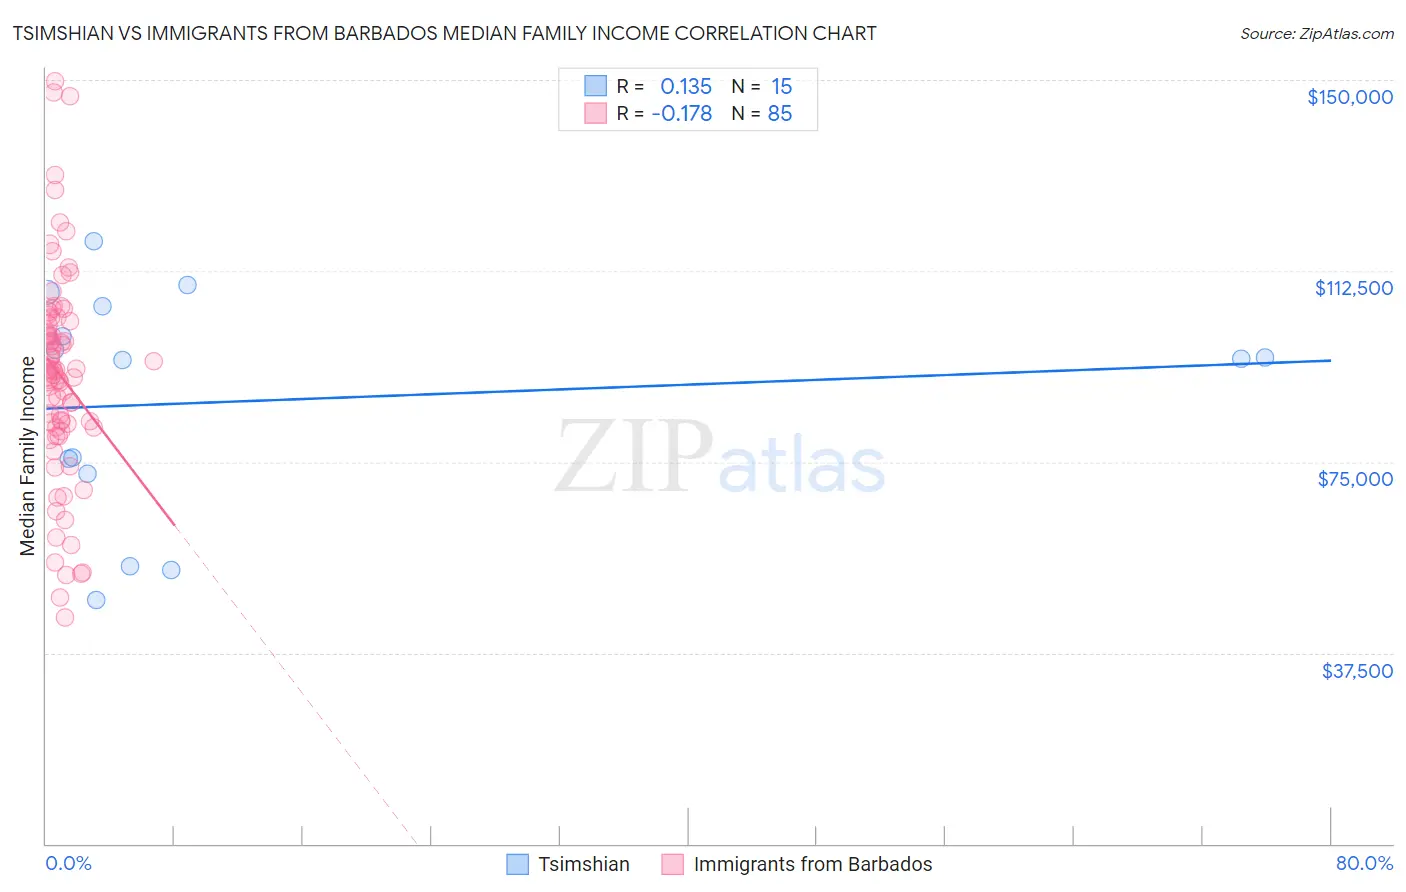
Tsimshian vs Immigrants from Barbados Median Family Income Correlation Chart
The statistical analysis conducted on geographies consisting of 15,626,544 people shows a poor positive correlation between the proportion of Tsimshian and median family income in the United States with a correlation coefficient (R) of 0.135 and weighted average of $101,543. Similarly, the statistical analysis conducted on geographies consisting of 112,740,718 people shows a poor negative correlation between the proportion of Immigrants from Barbados and median family income in the United States with a correlation coefficient (R) of -0.178 and weighted average of $92,419, a difference of 9.9%.
Median Family Income Correlation Summary
| Measurement | Tsimshian | Immigrants from Barbados |
| Minimum | $47,917 | $44,554 |
| Maximum | $118,333 | $149,653 |
| Range | $70,416 | $105,099 |
| Mean | $86,976 | $92,071 |
| Median | $95,278 | $92,856 |
| Interquartile 25% (IQ1) | $72,646 | $81,708 |
| Interquartile 75% (IQ3) | $105,493 | $103,000 |
| Interquartile Range (IQR) | $32,847 | $21,293 |
| Standard Deviation (Sample) | $22,202 | $20,843 |
| Standard Deviation (Population) | $21,449 | $20,721 |
Similar Demographics by Median Family Income
Demographics Similar to Tsimshian by Median Family Income
In terms of median family income, the demographic groups most similar to Tsimshian are Spaniard ($101,617, a difference of 0.070%), French Canadian ($101,634, a difference of 0.090%), Kenyan ($101,417, a difference of 0.12%), Immigrants from Costa Rica ($101,354, a difference of 0.19%), and South American ($101,856, a difference of 0.31%).
| Demographics | Rating | Rank | Median Family Income |
| Immigrants | Eastern Africa | 47.1 /100 | #175 | Average $102,451 |
| French | 46.1 /100 | #176 | Average $102,368 |
| Germans | 44.6 /100 | #177 | Average $102,254 |
| Welsh | 43.3 /100 | #178 | Average $102,151 |
| South Americans | 39.7 /100 | #179 | Fair $101,856 |
| French Canadians | 37.0 /100 | #180 | Fair $101,634 |
| Spaniards | 36.8 /100 | #181 | Fair $101,617 |
| Tsimshian | 35.9 /100 | #182 | Fair $101,543 |
| Kenyans | 34.5 /100 | #183 | Fair $101,417 |
| Immigrants | Costa Rica | 33.7 /100 | #184 | Fair $101,354 |
| Dutch | 31.9 /100 | #185 | Fair $101,192 |
| Celtics | 31.3 /100 | #186 | Fair $101,139 |
| Tlingit-Haida | 30.8 /100 | #187 | Fair $101,092 |
| Guamanians/Chamorros | 30.5 /100 | #188 | Fair $101,061 |
| Immigrants | Portugal | 29.6 /100 | #189 | Fair $100,984 |
Demographics Similar to Immigrants from Barbados by Median Family Income
In terms of median family income, the demographic groups most similar to Immigrants from Barbados are Immigrants from Guyana ($92,513, a difference of 0.10%), Immigrants from El Salvador ($92,545, a difference of 0.14%), Immigrants from Laos ($92,239, a difference of 0.20%), Nicaraguan ($92,231, a difference of 0.20%), and Immigrants from Somalia ($92,609, a difference of 0.21%).
| Demographics | Rating | Rank | Median Family Income |
| Immigrants | Senegal | 0.7 /100 | #247 | Tragic $92,912 |
| French American Indians | 0.7 /100 | #248 | Tragic $92,872 |
| Immigrants | Ecuador | 0.7 /100 | #249 | Tragic $92,837 |
| West Indians | 0.6 /100 | #250 | Tragic $92,765 |
| Immigrants | Somalia | 0.6 /100 | #251 | Tragic $92,609 |
| Immigrants | El Salvador | 0.6 /100 | #252 | Tragic $92,545 |
| Immigrants | Guyana | 0.6 /100 | #253 | Tragic $92,513 |
| Immigrants | Barbados | 0.5 /100 | #254 | Tragic $92,419 |
| Immigrants | Laos | 0.5 /100 | #255 | Tragic $92,239 |
| Nicaraguans | 0.5 /100 | #256 | Tragic $92,231 |
| Americans | 0.4 /100 | #257 | Tragic $92,096 |
| Osage | 0.4 /100 | #258 | Tragic $91,926 |
| Cape Verdeans | 0.4 /100 | #259 | Tragic $91,848 |
| Pennsylvania Germans | 0.4 /100 | #260 | Tragic $91,763 |
| Inupiat | 0.4 /100 | #261 | Tragic $91,730 |