Tsimshian vs Comanche Median Male Earnings
COMPARE
Tsimshian
Comanche
Median Male Earnings
Median Male Earnings Comparison
Tsimshian
Comanche
$48,836
MEDIAN MALE EARNINGS
0.4/ 100
METRIC RATING
269th/ 347
METRIC RANK
$48,202
MEDIAN MALE EARNINGS
0.2/ 100
METRIC RATING
280th/ 347
METRIC RANK
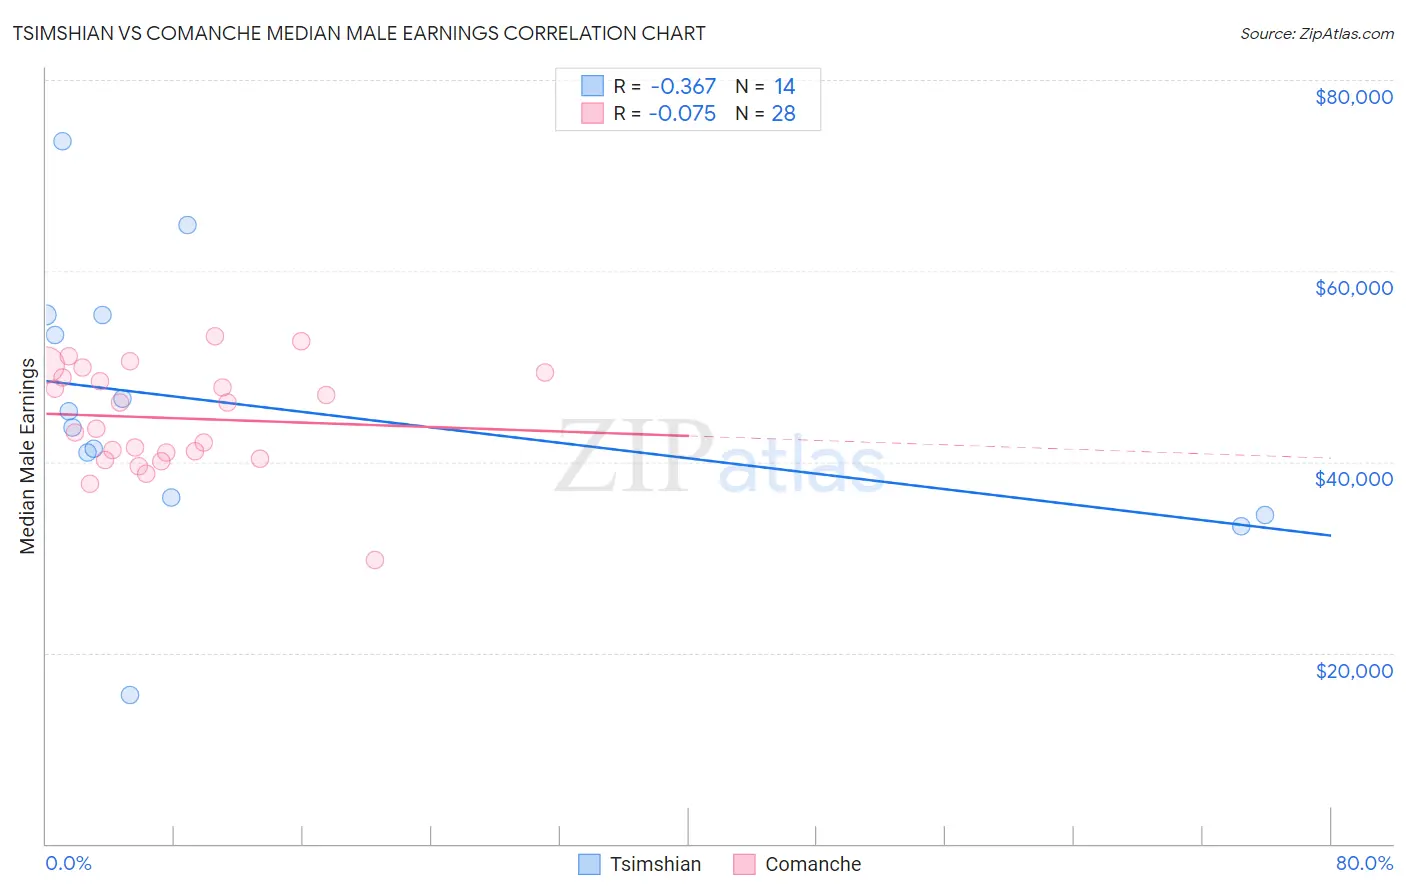
Tsimshian vs Comanche Median Male Earnings Correlation Chart
The statistical analysis conducted on geographies consisting of 15,625,423 people shows a mild negative correlation between the proportion of Tsimshian and median male earnings in the United States with a correlation coefficient (R) of -0.367 and weighted average of $48,836. Similarly, the statistical analysis conducted on geographies consisting of 109,761,350 people shows a slight negative correlation between the proportion of Comanche and median male earnings in the United States with a correlation coefficient (R) of -0.075 and weighted average of $48,202, a difference of 1.3%.
Median Male Earnings Correlation Summary
| Measurement | Tsimshian | Comanche |
| Minimum | $15,625 | $29,698 |
| Maximum | $73,588 | $53,182 |
| Range | $57,963 | $23,484 |
| Mean | $45,710 | $44,594 |
| Median | $44,489 | $44,855 |
| Interquartile 25% (IQ1) | $36,250 | $40,605 |
| Interquartile 75% (IQ3) | $55,386 | $49,111 |
| Interquartile Range (IQR) | $19,136 | $8,506 |
| Standard Deviation (Sample) | $14,437 | $5,459 |
| Standard Deviation (Population) | $13,911 | $5,361 |
Demographics Similar to Tsimshian and Comanche by Median Male Earnings
In terms of median male earnings, the demographic groups most similar to Tsimshian are Ute ($48,899, a difference of 0.13%), Potawatomi ($48,768, a difference of 0.14%), Cherokee ($48,669, a difference of 0.34%), Spanish American ($49,008, a difference of 0.35%), and Somali ($49,025, a difference of 0.39%). Similarly, the demographic groups most similar to Comanche are Hmong ($48,254, a difference of 0.11%), Marshallese ($48,137, a difference of 0.13%), Central American ($48,093, a difference of 0.23%), Immigrants from Liberia ($48,317, a difference of 0.24%), and Belizean ($48,358, a difference of 0.32%).
| Demographics | Rating | Rank | Median Male Earnings |
| Immigrants | Middle Africa | 0.6 /100 | #264 | Tragic $49,201 |
| Immigrants | Laos | 0.6 /100 | #265 | Tragic $49,190 |
| Somalis | 0.5 /100 | #266 | Tragic $49,025 |
| Spanish Americans | 0.5 /100 | #267 | Tragic $49,008 |
| Ute | 0.4 /100 | #268 | Tragic $48,899 |
| Tsimshian | 0.4 /100 | #269 | Tragic $48,836 |
| Potawatomi | 0.4 /100 | #270 | Tragic $48,768 |
| Cherokee | 0.3 /100 | #271 | Tragic $48,669 |
| Salvadorans | 0.3 /100 | #272 | Tragic $48,646 |
| Jamaicans | 0.3 /100 | #273 | Tragic $48,632 |
| Colville | 0.3 /100 | #274 | Tragic $48,516 |
| Immigrants | Somalia | 0.3 /100 | #275 | Tragic $48,439 |
| Blackfeet | 0.3 /100 | #276 | Tragic $48,402 |
| Belizeans | 0.2 /100 | #277 | Tragic $48,358 |
| Immigrants | Liberia | 0.2 /100 | #278 | Tragic $48,317 |
| Hmong | 0.2 /100 | #279 | Tragic $48,254 |
| Comanche | 0.2 /100 | #280 | Tragic $48,202 |
| Marshallese | 0.2 /100 | #281 | Tragic $48,137 |
| Central Americans | 0.2 /100 | #282 | Tragic $48,093 |
| Immigrants | Jamaica | 0.2 /100 | #283 | Tragic $48,040 |
| Africans | 0.2 /100 | #284 | Tragic $47,994 |