Tsimshian vs Immigrants from Haiti Median Male Earnings
COMPARE
Tsimshian
Immigrants from Haiti
Median Male Earnings
Median Male Earnings Comparison
Tsimshian
Immigrants from Haiti
$48,836
MEDIAN MALE EARNINGS
0.4/ 100
METRIC RATING
269th/ 347
METRIC RANK
$45,266
MEDIAN MALE EARNINGS
0.0/ 100
METRIC RATING
326th/ 347
METRIC RANK
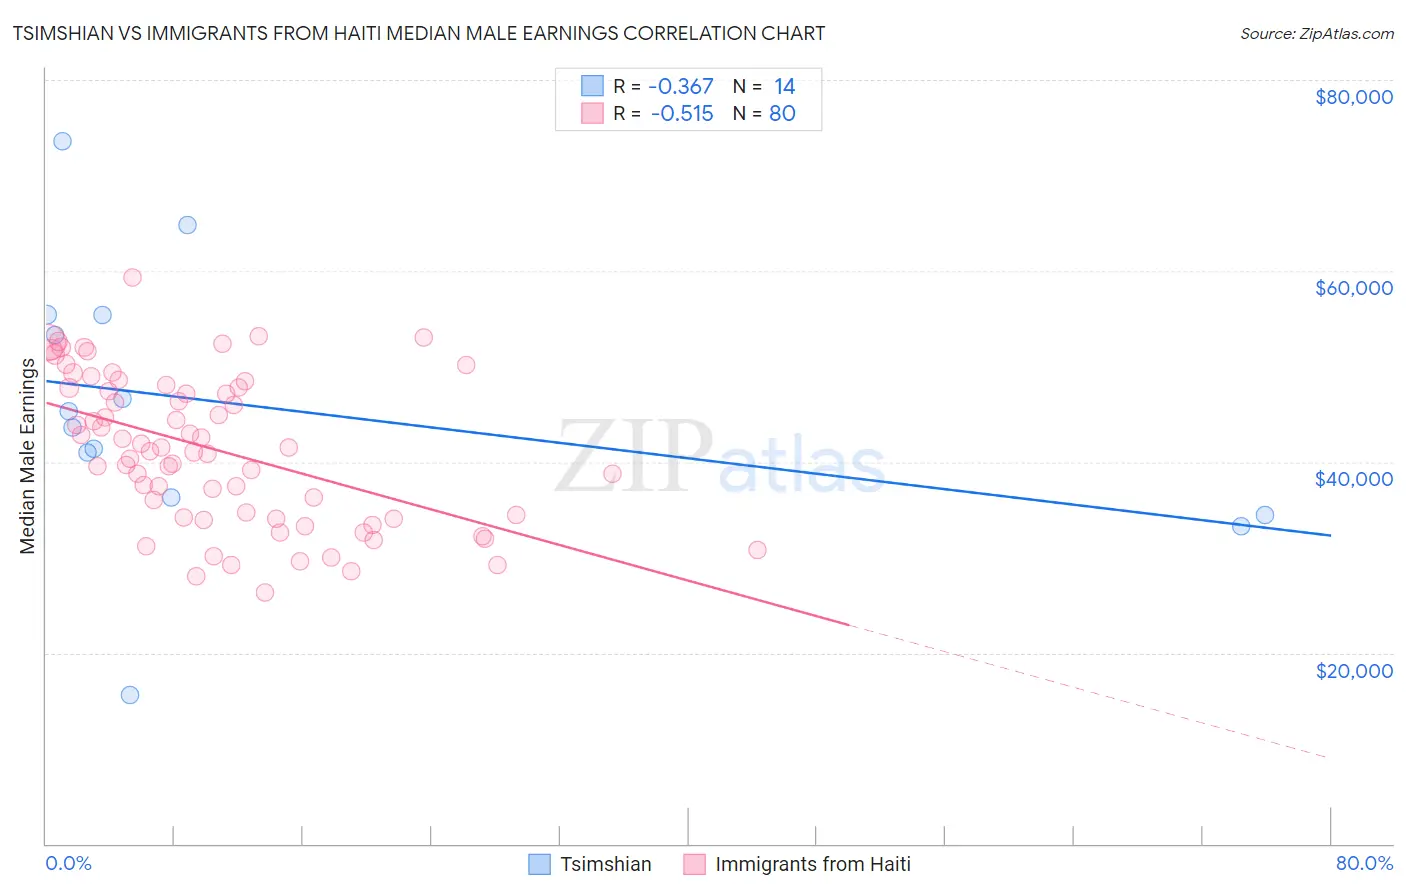
Tsimshian vs Immigrants from Haiti Median Male Earnings Correlation Chart
The statistical analysis conducted on geographies consisting of 15,625,423 people shows a mild negative correlation between the proportion of Tsimshian and median male earnings in the United States with a correlation coefficient (R) of -0.367 and weighted average of $48,836. Similarly, the statistical analysis conducted on geographies consisting of 225,244,233 people shows a substantial negative correlation between the proportion of Immigrants from Haiti and median male earnings in the United States with a correlation coefficient (R) of -0.515 and weighted average of $45,266, a difference of 7.9%.
Median Male Earnings Correlation Summary
| Measurement | Tsimshian | Immigrants from Haiti |
| Minimum | $15,625 | $26,317 |
| Maximum | $73,588 | $59,316 |
| Range | $57,963 | $32,999 |
| Mean | $45,710 | $41,227 |
| Median | $44,489 | $41,309 |
| Interquartile 25% (IQ1) | $36,250 | $34,055 |
| Interquartile 75% (IQ3) | $55,386 | $47,765 |
| Interquartile Range (IQR) | $19,136 | $13,710 |
| Standard Deviation (Sample) | $14,437 | $7,780 |
| Standard Deviation (Population) | $13,911 | $7,731 |
Similar Demographics by Median Male Earnings
Demographics Similar to Tsimshian by Median Male Earnings
In terms of median male earnings, the demographic groups most similar to Tsimshian are Ute ($48,899, a difference of 0.13%), Potawatomi ($48,768, a difference of 0.14%), Cherokee ($48,669, a difference of 0.34%), Spanish American ($49,008, a difference of 0.35%), and Somali ($49,025, a difference of 0.39%).
| Demographics | Rating | Rank | Median Male Earnings |
| Immigrants | West Indies | 0.6 /100 | #262 | Tragic $49,271 |
| Nicaraguans | 0.6 /100 | #263 | Tragic $49,215 |
| Immigrants | Middle Africa | 0.6 /100 | #264 | Tragic $49,201 |
| Immigrants | Laos | 0.6 /100 | #265 | Tragic $49,190 |
| Somalis | 0.5 /100 | #266 | Tragic $49,025 |
| Spanish Americans | 0.5 /100 | #267 | Tragic $49,008 |
| Ute | 0.4 /100 | #268 | Tragic $48,899 |
| Tsimshian | 0.4 /100 | #269 | Tragic $48,836 |
| Potawatomi | 0.4 /100 | #270 | Tragic $48,768 |
| Cherokee | 0.3 /100 | #271 | Tragic $48,669 |
| Salvadorans | 0.3 /100 | #272 | Tragic $48,646 |
| Jamaicans | 0.3 /100 | #273 | Tragic $48,632 |
| Colville | 0.3 /100 | #274 | Tragic $48,516 |
| Immigrants | Somalia | 0.3 /100 | #275 | Tragic $48,439 |
| Blackfeet | 0.3 /100 | #276 | Tragic $48,402 |
Demographics Similar to Immigrants from Haiti by Median Male Earnings
In terms of median male earnings, the demographic groups most similar to Immigrants from Haiti are Immigrants from Bahamas ($45,176, a difference of 0.20%), Kiowa ($45,094, a difference of 0.38%), Yuman ($45,446, a difference of 0.40%), Black/African American ($45,523, a difference of 0.57%), and Yakama ($45,002, a difference of 0.59%).
| Demographics | Rating | Rank | Median Male Earnings |
| Haitians | 0.0 /100 | #319 | Tragic $45,903 |
| Immigrants | Honduras | 0.0 /100 | #320 | Tragic $45,787 |
| Fijians | 0.0 /100 | #321 | Tragic $45,607 |
| Sioux | 0.0 /100 | #322 | Tragic $45,566 |
| Immigrants | Central America | 0.0 /100 | #323 | Tragic $45,538 |
| Blacks/African Americans | 0.0 /100 | #324 | Tragic $45,523 |
| Yuman | 0.0 /100 | #325 | Tragic $45,446 |
| Immigrants | Haiti | 0.0 /100 | #326 | Tragic $45,266 |
| Immigrants | Bahamas | 0.0 /100 | #327 | Tragic $45,176 |
| Kiowa | 0.0 /100 | #328 | Tragic $45,094 |
| Yakama | 0.0 /100 | #329 | Tragic $45,002 |
| Immigrants | Mexico | 0.0 /100 | #330 | Tragic $44,960 |
| Natives/Alaskans | 0.0 /100 | #331 | Tragic $44,775 |
| Bahamians | 0.0 /100 | #332 | Tragic $44,756 |
| Immigrants | Congo | 0.0 /100 | #333 | Tragic $44,204 |