Tsimshian vs Assyrian/Chaldean/Syriac Median Male Earnings
COMPARE
Tsimshian
Assyrian/Chaldean/Syriac
Median Male Earnings
Median Male Earnings Comparison
Tsimshian
Assyrians/Chaldeans/Syriacs
$48,836
MEDIAN MALE EARNINGS
0.4/ 100
METRIC RATING
269th/ 347
METRIC RANK
$58,437
MEDIAN MALE EARNINGS
97.9/ 100
METRIC RATING
100th/ 347
METRIC RANK
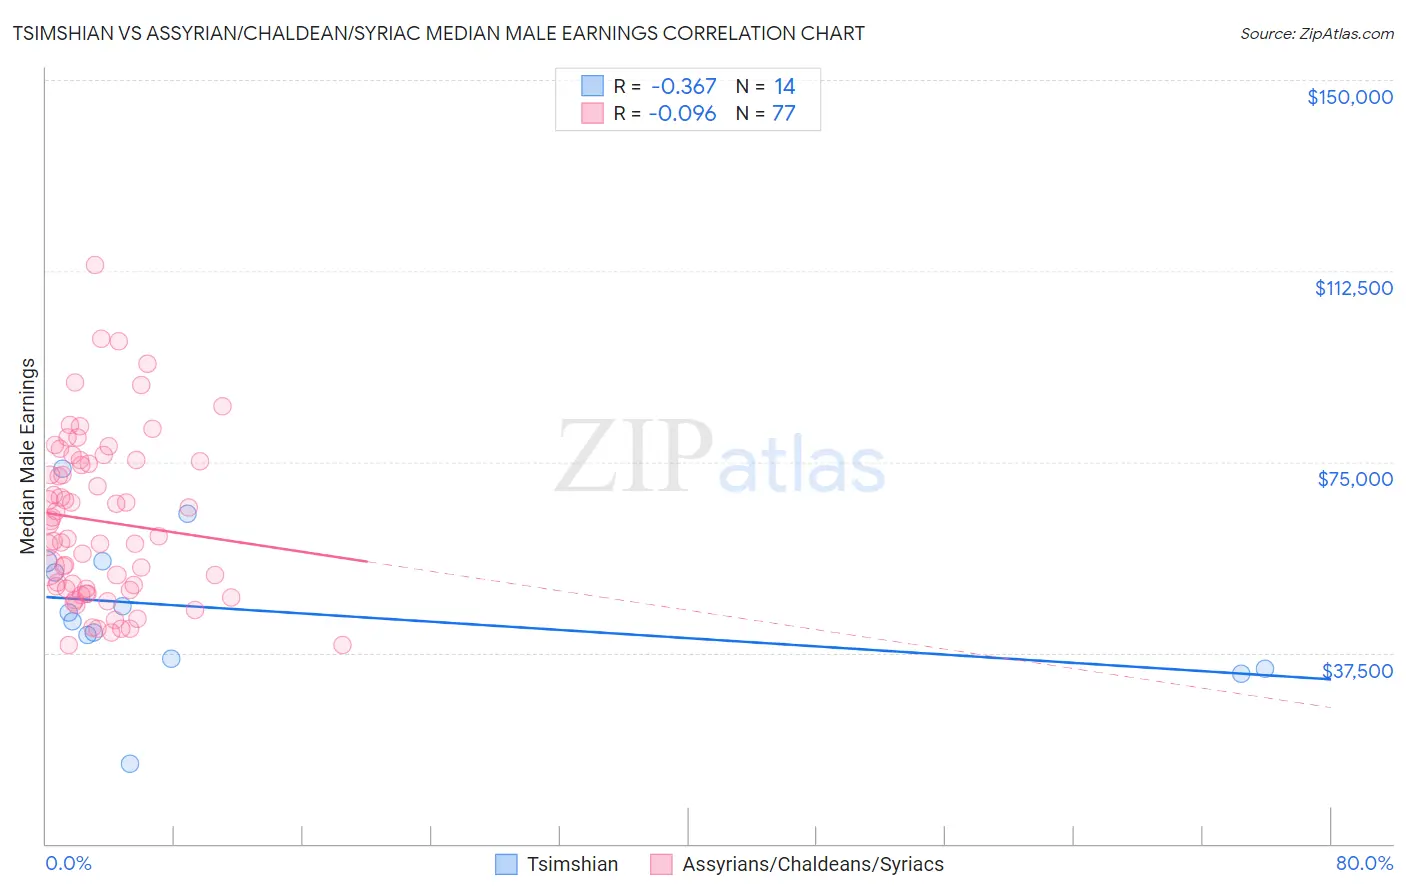
Tsimshian vs Assyrian/Chaldean/Syriac Median Male Earnings Correlation Chart
The statistical analysis conducted on geographies consisting of 15,625,423 people shows a mild negative correlation between the proportion of Tsimshian and median male earnings in the United States with a correlation coefficient (R) of -0.367 and weighted average of $48,836. Similarly, the statistical analysis conducted on geographies consisting of 110,268,457 people shows a slight negative correlation between the proportion of Assyrians/Chaldeans/Syriacs and median male earnings in the United States with a correlation coefficient (R) of -0.096 and weighted average of $58,437, a difference of 19.7%.
Median Male Earnings Correlation Summary
| Measurement | Tsimshian | Assyrian/Chaldean/Syriac |
| Minimum | $15,625 | $38,990 |
| Maximum | $73,588 | $113,676 |
| Range | $57,963 | $74,686 |
| Mean | $45,710 | $63,347 |
| Median | $44,489 | $60,406 |
| Interquartile 25% (IQ1) | $36,250 | $49,882 |
| Interquartile 75% (IQ3) | $55,386 | $75,136 |
| Interquartile Range (IQR) | $19,136 | $25,254 |
| Standard Deviation (Sample) | $14,437 | $16,152 |
| Standard Deviation (Population) | $13,911 | $16,047 |
Similar Demographics by Median Male Earnings
Demographics Similar to Tsimshian by Median Male Earnings
In terms of median male earnings, the demographic groups most similar to Tsimshian are Ute ($48,899, a difference of 0.13%), Potawatomi ($48,768, a difference of 0.14%), Cherokee ($48,669, a difference of 0.34%), Spanish American ($49,008, a difference of 0.35%), and Somali ($49,025, a difference of 0.39%).
| Demographics | Rating | Rank | Median Male Earnings |
| Immigrants | West Indies | 0.6 /100 | #262 | Tragic $49,271 |
| Nicaraguans | 0.6 /100 | #263 | Tragic $49,215 |
| Immigrants | Middle Africa | 0.6 /100 | #264 | Tragic $49,201 |
| Immigrants | Laos | 0.6 /100 | #265 | Tragic $49,190 |
| Somalis | 0.5 /100 | #266 | Tragic $49,025 |
| Spanish Americans | 0.5 /100 | #267 | Tragic $49,008 |
| Ute | 0.4 /100 | #268 | Tragic $48,899 |
| Tsimshian | 0.4 /100 | #269 | Tragic $48,836 |
| Potawatomi | 0.4 /100 | #270 | Tragic $48,768 |
| Cherokee | 0.3 /100 | #271 | Tragic $48,669 |
| Salvadorans | 0.3 /100 | #272 | Tragic $48,646 |
| Jamaicans | 0.3 /100 | #273 | Tragic $48,632 |
| Colville | 0.3 /100 | #274 | Tragic $48,516 |
| Immigrants | Somalia | 0.3 /100 | #275 | Tragic $48,439 |
| Blackfeet | 0.3 /100 | #276 | Tragic $48,402 |
Demographics Similar to Assyrians/Chaldeans/Syriacs by Median Male Earnings
In terms of median male earnings, the demographic groups most similar to Assyrians/Chaldeans/Syriacs are Immigrants from Poland ($58,452, a difference of 0.030%), Jordanian ($58,500, a difference of 0.11%), Immigrants from Brazil ($58,324, a difference of 0.19%), Northern European ($58,588, a difference of 0.26%), and Albanian ($58,680, a difference of 0.42%).
| Demographics | Rating | Rank | Median Male Earnings |
| Immigrants | Southern Europe | 99.0 /100 | #93 | Exceptional $59,217 |
| Immigrants | North Macedonia | 99.0 /100 | #94 | Exceptional $59,189 |
| Immigrants | Lebanon | 98.6 /100 | #95 | Exceptional $58,835 |
| Albanians | 98.4 /100 | #96 | Exceptional $58,680 |
| Northern Europeans | 98.2 /100 | #97 | Exceptional $58,588 |
| Jordanians | 98.1 /100 | #98 | Exceptional $58,500 |
| Immigrants | Poland | 98.0 /100 | #99 | Exceptional $58,452 |
| Assyrians/Chaldeans/Syriacs | 97.9 /100 | #100 | Exceptional $58,437 |
| Immigrants | Brazil | 97.7 /100 | #101 | Exceptional $58,324 |
| Syrians | 97.4 /100 | #102 | Exceptional $58,187 |
| Poles | 97.3 /100 | #103 | Exceptional $58,139 |
| Armenians | 97.3 /100 | #104 | Exceptional $58,134 |
| Immigrants | Western Asia | 97.3 /100 | #105 | Exceptional $58,131 |
| Immigrants | Northern Africa | 96.9 /100 | #106 | Exceptional $58,008 |
| Serbians | 96.8 /100 | #107 | Exceptional $57,975 |