Bahamian vs Immigrants from Lithuania Median Male Earnings
COMPARE
Bahamian
Immigrants from Lithuania
Median Male Earnings
Median Male Earnings Comparison
Bahamians
Immigrants from Lithuania
$44,756
MEDIAN MALE EARNINGS
0.0/ 100
METRIC RATING
332nd/ 347
METRIC RANK
$63,346
MEDIAN MALE EARNINGS
100.0/ 100
METRIC RATING
33rd/ 347
METRIC RANK
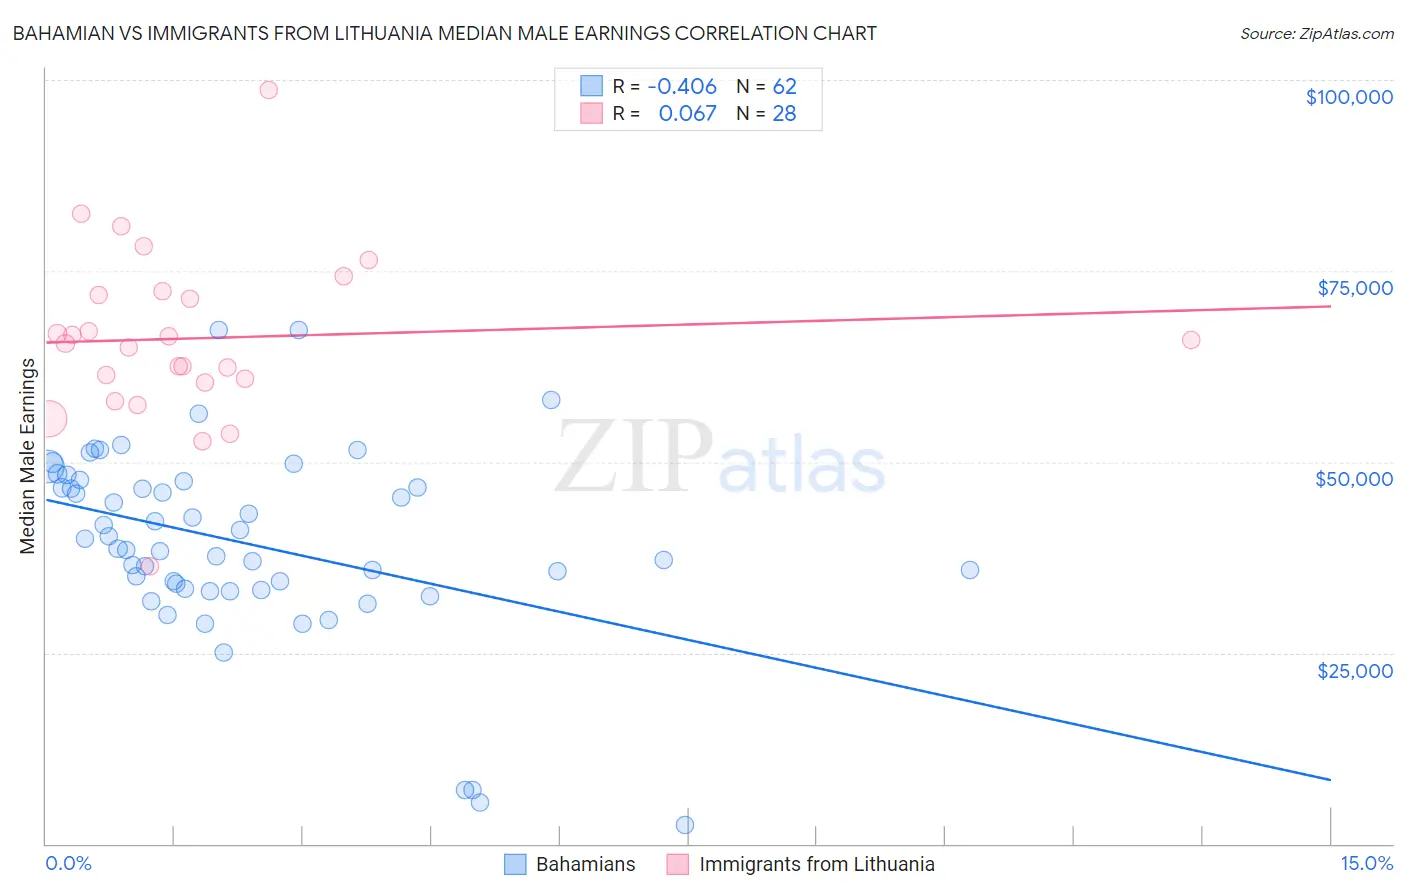
Bahamian vs Immigrants from Lithuania Median Male Earnings Correlation Chart
The statistical analysis conducted on geographies consisting of 112,679,918 people shows a moderate negative correlation between the proportion of Bahamians and median male earnings in the United States with a correlation coefficient (R) of -0.406 and weighted average of $44,756. Similarly, the statistical analysis conducted on geographies consisting of 117,720,522 people shows a slight positive correlation between the proportion of Immigrants from Lithuania and median male earnings in the United States with a correlation coefficient (R) of 0.067 and weighted average of $63,346, a difference of 41.5%.
Median Male Earnings Correlation Summary
| Measurement | Bahamian | Immigrants from Lithuania |
| Minimum | $2,499 | $36,313 |
| Maximum | $67,317 | $98,618 |
| Range | $64,818 | $62,305 |
| Mean | $39,425 | $66,192 |
| Median | $39,316 | $65,733 |
| Interquartile 25% (IQ1) | $33,442 | $60,577 |
| Interquartile 75% (IQ3) | $47,537 | $72,153 |
| Interquartile Range (IQR) | $14,095 | $11,576 |
| Standard Deviation (Sample) | $12,607 | $11,479 |
| Standard Deviation (Population) | $12,505 | $11,272 |
Similar Demographics by Median Male Earnings
Demographics Similar to Bahamians by Median Male Earnings
In terms of median male earnings, the demographic groups most similar to Bahamians are Native/Alaskan ($44,775, a difference of 0.040%), Immigrants from Mexico ($44,960, a difference of 0.46%), Yakama ($45,002, a difference of 0.55%), Kiowa ($45,094, a difference of 0.76%), and Immigrants from Bahamas ($45,176, a difference of 0.94%).
| Demographics | Rating | Rank | Median Male Earnings |
| Yuman | 0.0 /100 | #325 | Tragic $45,446 |
| Immigrants | Haiti | 0.0 /100 | #326 | Tragic $45,266 |
| Immigrants | Bahamas | 0.0 /100 | #327 | Tragic $45,176 |
| Kiowa | 0.0 /100 | #328 | Tragic $45,094 |
| Yakama | 0.0 /100 | #329 | Tragic $45,002 |
| Immigrants | Mexico | 0.0 /100 | #330 | Tragic $44,960 |
| Natives/Alaskans | 0.0 /100 | #331 | Tragic $44,775 |
| Bahamians | 0.0 /100 | #332 | Tragic $44,756 |
| Immigrants | Congo | 0.0 /100 | #333 | Tragic $44,204 |
| Immigrants | Yemen | 0.0 /100 | #334 | Tragic $44,083 |
| Spanish American Indians | 0.0 /100 | #335 | Tragic $44,010 |
| Immigrants | Cuba | 0.0 /100 | #336 | Tragic $43,461 |
| Menominee | 0.0 /100 | #337 | Tragic $42,581 |
| Crow | 0.0 /100 | #338 | Tragic $42,434 |
| Pima | 0.0 /100 | #339 | Tragic $42,357 |
Demographics Similar to Immigrants from Lithuania by Median Male Earnings
In terms of median male earnings, the demographic groups most similar to Immigrants from Lithuania are Immigrants from Russia ($63,326, a difference of 0.030%), Soviet Union ($63,382, a difference of 0.060%), Immigrants from Asia ($63,240, a difference of 0.17%), Israeli ($63,228, a difference of 0.19%), and Latvian ($63,498, a difference of 0.24%).
| Demographics | Rating | Rank | Median Male Earnings |
| Turks | 100.0 /100 | #26 | Exceptional $64,253 |
| Immigrants | Switzerland | 100.0 /100 | #27 | Exceptional $63,944 |
| Russians | 100.0 /100 | #28 | Exceptional $63,939 |
| Asians | 100.0 /100 | #29 | Exceptional $63,827 |
| Immigrants | France | 100.0 /100 | #30 | Exceptional $63,715 |
| Latvians | 100.0 /100 | #31 | Exceptional $63,498 |
| Soviet Union | 100.0 /100 | #32 | Exceptional $63,382 |
| Immigrants | Lithuania | 100.0 /100 | #33 | Exceptional $63,346 |
| Immigrants | Russia | 100.0 /100 | #34 | Exceptional $63,326 |
| Immigrants | Asia | 100.0 /100 | #35 | Exceptional $63,240 |
| Israelis | 100.0 /100 | #36 | Exceptional $63,228 |
| Immigrants | Sri Lanka | 100.0 /100 | #37 | Exceptional $63,099 |
| Maltese | 100.0 /100 | #38 | Exceptional $62,953 |
| Immigrants | South Africa | 100.0 /100 | #39 | Exceptional $62,899 |
| Australians | 100.0 /100 | #40 | Exceptional $62,857 |