Maltese vs Immigrants from Lithuania Median Male Earnings
COMPARE
Maltese
Immigrants from Lithuania
Median Male Earnings
Median Male Earnings Comparison
Maltese
Immigrants from Lithuania
$62,953
MEDIAN MALE EARNINGS
100.0/ 100
METRIC RATING
38th/ 347
METRIC RANK
$63,346
MEDIAN MALE EARNINGS
100.0/ 100
METRIC RATING
33rd/ 347
METRIC RANK
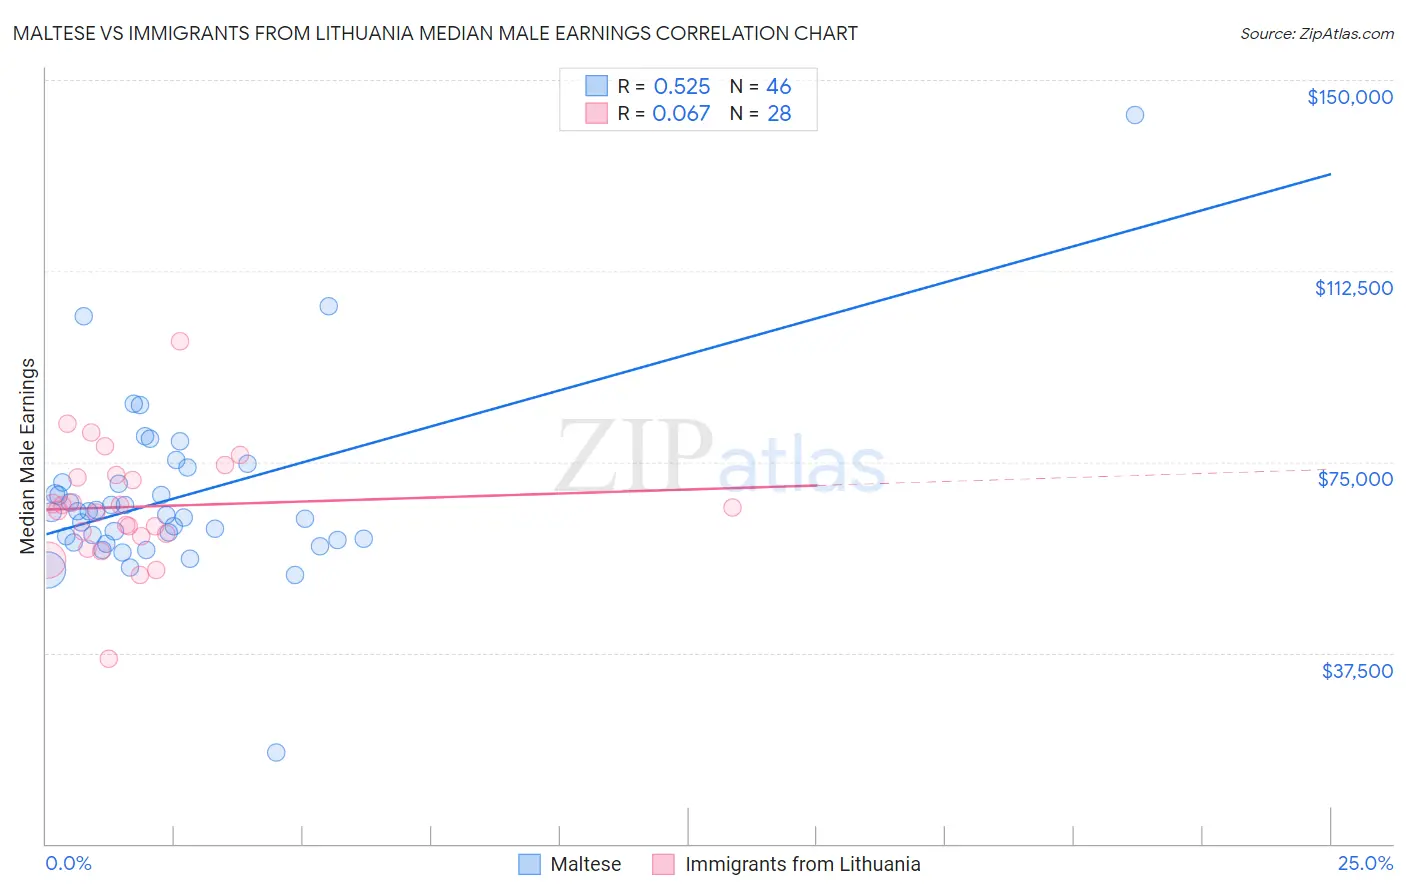
Maltese vs Immigrants from Lithuania Median Male Earnings Correlation Chart
The statistical analysis conducted on geographies consisting of 126,470,445 people shows a substantial positive correlation between the proportion of Maltese and median male earnings in the United States with a correlation coefficient (R) of 0.525 and weighted average of $62,953. Similarly, the statistical analysis conducted on geographies consisting of 117,720,522 people shows a slight positive correlation between the proportion of Immigrants from Lithuania and median male earnings in the United States with a correlation coefficient (R) of 0.067 and weighted average of $63,346, a difference of 0.62%.
Median Male Earnings Correlation Summary
| Measurement | Maltese | Immigrants from Lithuania |
| Minimum | $17,917 | $36,313 |
| Maximum | $143,125 | $98,618 |
| Range | $125,208 | $62,305 |
| Mean | $67,890 | $66,192 |
| Median | $64,879 | $65,733 |
| Interquartile 25% (IQ1) | $59,600 | $60,577 |
| Interquartile 75% (IQ3) | $71,008 | $72,153 |
| Interquartile Range (IQR) | $11,408 | $11,576 |
| Standard Deviation (Sample) | $17,590 | $11,479 |
| Standard Deviation (Population) | $17,397 | $11,272 |
Demographics Similar to Maltese and Immigrants from Lithuania by Median Male Earnings
In terms of median male earnings, the demographic groups most similar to Maltese are Immigrants from South Africa ($62,899, a difference of 0.090%), Australian ($62,857, a difference of 0.15%), Immigrants from Sri Lanka ($63,099, a difference of 0.23%), Immigrants from Turkey ($62,728, a difference of 0.36%), and Immigrants from Greece ($62,689, a difference of 0.42%). Similarly, the demographic groups most similar to Immigrants from Lithuania are Immigrants from Russia ($63,326, a difference of 0.030%), Soviet Union ($63,382, a difference of 0.060%), Immigrants from Asia ($63,240, a difference of 0.17%), Israeli ($63,228, a difference of 0.19%), and Latvian ($63,498, a difference of 0.24%).
| Demographics | Rating | Rank | Median Male Earnings |
| Immigrants | Denmark | 100.0 /100 | #25 | Exceptional $64,625 |
| Turks | 100.0 /100 | #26 | Exceptional $64,253 |
| Immigrants | Switzerland | 100.0 /100 | #27 | Exceptional $63,944 |
| Russians | 100.0 /100 | #28 | Exceptional $63,939 |
| Asians | 100.0 /100 | #29 | Exceptional $63,827 |
| Immigrants | France | 100.0 /100 | #30 | Exceptional $63,715 |
| Latvians | 100.0 /100 | #31 | Exceptional $63,498 |
| Soviet Union | 100.0 /100 | #32 | Exceptional $63,382 |
| Immigrants | Lithuania | 100.0 /100 | #33 | Exceptional $63,346 |
| Immigrants | Russia | 100.0 /100 | #34 | Exceptional $63,326 |
| Immigrants | Asia | 100.0 /100 | #35 | Exceptional $63,240 |
| Israelis | 100.0 /100 | #36 | Exceptional $63,228 |
| Immigrants | Sri Lanka | 100.0 /100 | #37 | Exceptional $63,099 |
| Maltese | 100.0 /100 | #38 | Exceptional $62,953 |
| Immigrants | South Africa | 100.0 /100 | #39 | Exceptional $62,899 |
| Australians | 100.0 /100 | #40 | Exceptional $62,857 |
| Immigrants | Turkey | 100.0 /100 | #41 | Exceptional $62,728 |
| Immigrants | Greece | 100.0 /100 | #42 | Exceptional $62,689 |
| Immigrants | Belarus | 100.0 /100 | #43 | Exceptional $62,658 |
| Cambodians | 100.0 /100 | #44 | Exceptional $62,516 |
| Bulgarians | 100.0 /100 | #45 | Exceptional $62,378 |