Creek vs Immigrants from Lithuania Median Male Earnings
COMPARE
Creek
Immigrants from Lithuania
Median Male Earnings
Median Male Earnings Comparison
Creek
Immigrants from Lithuania
$46,594
MEDIAN MALE EARNINGS
0.0/ 100
METRIC RATING
309th/ 347
METRIC RANK
$63,346
MEDIAN MALE EARNINGS
100.0/ 100
METRIC RATING
33rd/ 347
METRIC RANK
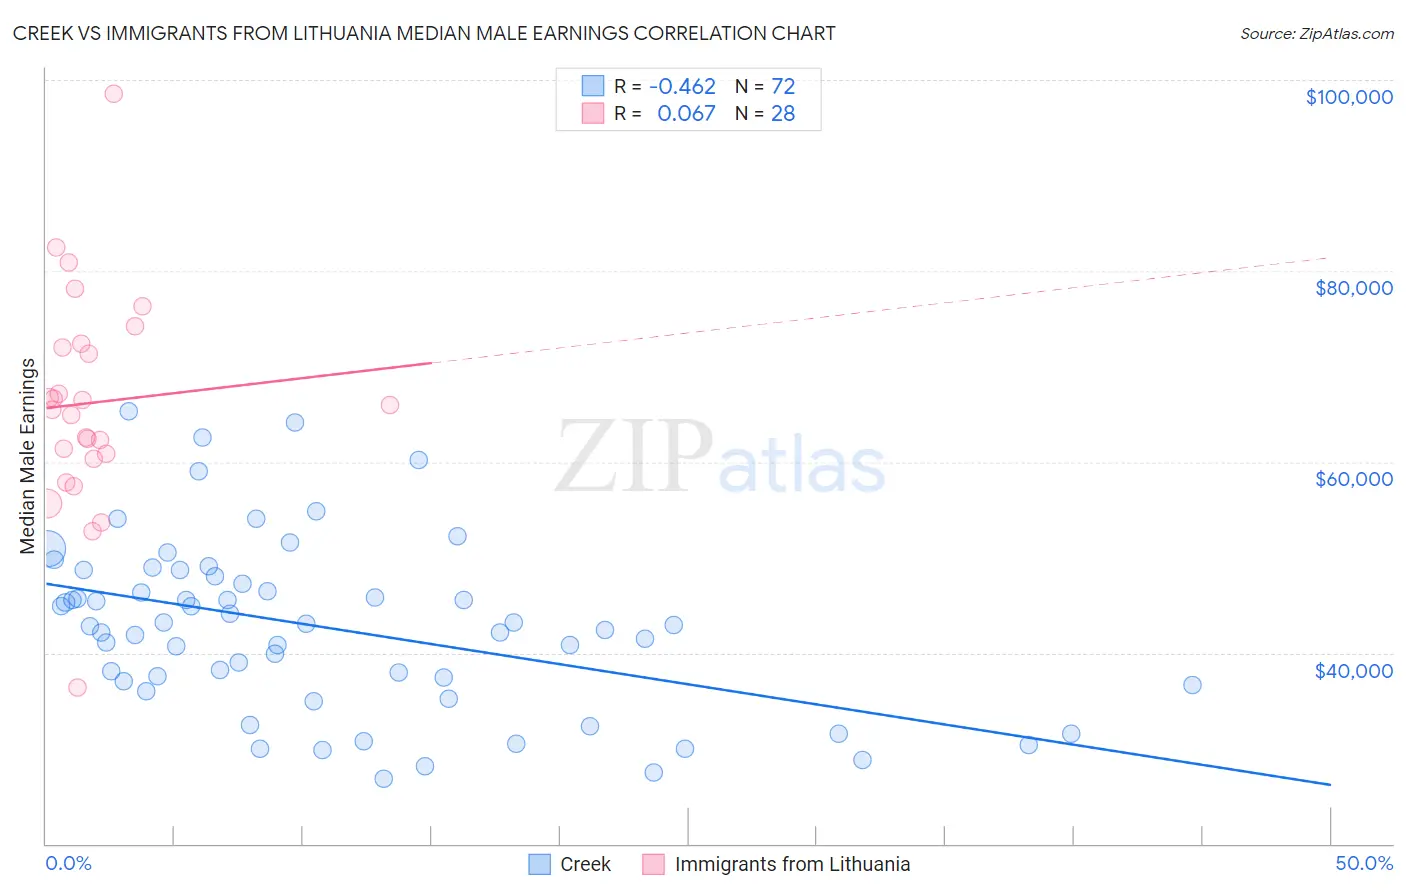
Creek vs Immigrants from Lithuania Median Male Earnings Correlation Chart
The statistical analysis conducted on geographies consisting of 178,430,593 people shows a moderate negative correlation between the proportion of Creek and median male earnings in the United States with a correlation coefficient (R) of -0.462 and weighted average of $46,594. Similarly, the statistical analysis conducted on geographies consisting of 117,720,522 people shows a slight positive correlation between the proportion of Immigrants from Lithuania and median male earnings in the United States with a correlation coefficient (R) of 0.067 and weighted average of $63,346, a difference of 35.9%.
Median Male Earnings Correlation Summary
| Measurement | Creek | Immigrants from Lithuania |
| Minimum | $26,855 | $36,313 |
| Maximum | $65,299 | $98,618 |
| Range | $38,444 | $62,305 |
| Mean | $42,595 | $66,192 |
| Median | $42,837 | $65,733 |
| Interquartile 25% (IQ1) | $36,835 | $60,577 |
| Interquartile 75% (IQ3) | $47,588 | $72,153 |
| Interquartile Range (IQR) | $10,753 | $11,576 |
| Standard Deviation (Sample) | $8,932 | $11,479 |
| Standard Deviation (Population) | $8,870 | $11,272 |
Similar Demographics by Median Male Earnings
Demographics Similar to Creek by Median Male Earnings
In terms of median male earnings, the demographic groups most similar to Creek are Cuban ($46,580, a difference of 0.030%), Ottawa ($46,611, a difference of 0.040%), Dutch West Indian ($46,656, a difference of 0.13%), Immigrants from Dominican Republic ($46,655, a difference of 0.13%), and Guatemalan ($46,736, a difference of 0.30%).
| Demographics | Rating | Rank | Median Male Earnings |
| Seminole | 0.1 /100 | #302 | Tragic $46,783 |
| Yaqui | 0.1 /100 | #303 | Tragic $46,777 |
| Bangladeshis | 0.1 /100 | #304 | Tragic $46,744 |
| Guatemalans | 0.0 /100 | #305 | Tragic $46,736 |
| Dutch West Indians | 0.0 /100 | #306 | Tragic $46,656 |
| Immigrants | Dominican Republic | 0.0 /100 | #307 | Tragic $46,655 |
| Ottawa | 0.0 /100 | #308 | Tragic $46,611 |
| Creek | 0.0 /100 | #309 | Tragic $46,594 |
| Cubans | 0.0 /100 | #310 | Tragic $46,580 |
| Apache | 0.0 /100 | #311 | Tragic $46,429 |
| Hispanics or Latinos | 0.0 /100 | #312 | Tragic $46,419 |
| Hondurans | 0.0 /100 | #313 | Tragic $46,374 |
| Chippewa | 0.0 /100 | #314 | Tragic $46,368 |
| Immigrants | Guatemala | 0.0 /100 | #315 | Tragic $46,244 |
| Immigrants | Caribbean | 0.0 /100 | #316 | Tragic $46,193 |
Demographics Similar to Immigrants from Lithuania by Median Male Earnings
In terms of median male earnings, the demographic groups most similar to Immigrants from Lithuania are Immigrants from Russia ($63,326, a difference of 0.030%), Soviet Union ($63,382, a difference of 0.060%), Immigrants from Asia ($63,240, a difference of 0.17%), Israeli ($63,228, a difference of 0.19%), and Latvian ($63,498, a difference of 0.24%).
| Demographics | Rating | Rank | Median Male Earnings |
| Turks | 100.0 /100 | #26 | Exceptional $64,253 |
| Immigrants | Switzerland | 100.0 /100 | #27 | Exceptional $63,944 |
| Russians | 100.0 /100 | #28 | Exceptional $63,939 |
| Asians | 100.0 /100 | #29 | Exceptional $63,827 |
| Immigrants | France | 100.0 /100 | #30 | Exceptional $63,715 |
| Latvians | 100.0 /100 | #31 | Exceptional $63,498 |
| Soviet Union | 100.0 /100 | #32 | Exceptional $63,382 |
| Immigrants | Lithuania | 100.0 /100 | #33 | Exceptional $63,346 |
| Immigrants | Russia | 100.0 /100 | #34 | Exceptional $63,326 |
| Immigrants | Asia | 100.0 /100 | #35 | Exceptional $63,240 |
| Israelis | 100.0 /100 | #36 | Exceptional $63,228 |
| Immigrants | Sri Lanka | 100.0 /100 | #37 | Exceptional $63,099 |
| Maltese | 100.0 /100 | #38 | Exceptional $62,953 |
| Immigrants | South Africa | 100.0 /100 | #39 | Exceptional $62,899 |
| Australians | 100.0 /100 | #40 | Exceptional $62,857 |