Tlingit-Haida vs Mongolian Householder Income Under 25 years

COMPARE

Tlingit-Haida
Race
Ancestry
AfghanAfricanAlaska NativeAlaskan AthabascanAlbanianAleutAlsatianAmericanApacheArabArapahoArgentineanArmenianAssyrian/Chaldean/SyriacAustralianAustrianBahamianBangladeshiBarbadianBasqueBelgianBelizeanBermudanBhutaneseBlackfeetBolivianBrazilianBritishBritish West IndianBulgarianBurmeseCajunCambodianCanadianCape VerdeanCarpatho RusynCelticCentral AmericanCentral American IndianCherokeeCheyenneChickasawChileanChineseChippewaChoctawColombianColvilleComancheCosta RicanCreeCreekCroatianCrowCubanCypriotCzechCzechoslovakianDanishDelawareDominicanDutchDutch West IndianEastern EuropeanEcuadorianEgyptianEnglishEstonianEthiopianEuropeanFijianFilipinoFinnishFrenchFrench American IndianFrench CanadianGermanGerman RussianGhanaianGreekGuamanian/ChamorroGuatemalanGuyaneseHaitianHmongHonduranHopiHoumaHungarianIcelanderIndian (Asian)IndonesianInupiatIranianIraqiIrishIroquoisIsraeliItalianJamaicanJapaneseJordanianKenyanKiowaKoreanLaotianLatvianLebaneseLiberianLithuanianLumbeeLuxembourgerMacedonianMalaysianMalteseMarshalleseMenomineeMexicanMexican American IndianMoroccanNative HawaiianNavajoNepaleseNew ZealanderNicaraguanNigerianNorthern EuropeanNorwegianOkinawanOsageOttawaPaiutePakistaniPalestinianPanamanianParaguayanPennsylvania GermanPeruvianPimaPolishPortuguesePotawatomiPuebloPuerto RicanPuget Sound SalishRomanianRussianSalvadoranSamoanScandinavianScotch-IrishScottishSeminoleSenegaleseSerbianShoshoneSierra LeoneanSiouxSlavicSlovakSloveneSomaliSouth AfricanSouth AmericanSouth American IndianSoviet UnionSpaniardSpanishSpanish AmericanSpanish American IndianSri LankanSubsaharan AfricanSudaneseSwedishSwissSyrianTaiwaneseThaiTlingit-HaidaTohono O'OdhamTonganTrinidadian and TobagonianTsimshianTurkishU.S. Virgin IslanderUgandanUkrainianUruguayanUteVenezuelanVietnameseWelshWest IndianYakamaYaquiYugoslavianYumanYup'ikZimbabwean
Immigration
NonimmigrantsImmigrantsAfghanistanAfricaAlbaniaArgentinaArmeniaAsiaAustraliaAustriaBahamasBangladeshBarbadosBelarusBelgiumBelizeBoliviaBosnia and HerzegovinaBrazilBulgariaBurma/MyanmarCabo VerdeCambodiaCameroonCanadaCaribbeanCentral AmericaChileChinaColombiaCongoCosta RicaCroatiaCubaCzechoslovakiaDenmarkDominicaDominican RepublicEastern AfricaEastern AsiaEastern EuropeEcuadorEgyptEl SalvadorEnglandEritreaEthiopiaEuropeFijiFranceGermanyGhanaGreeceGrenadaGuatemalaGuyanaHaitiHondurasHong KongHungaryIndiaIndonesiaIranIraqIrelandIsraelItalyJamaicaJapanJordanKazakhstanKenyaKoreaKuwaitLaosLatin AmericaLatviaLebanonLiberiaLithuaniaMalaysiaMexicoMicronesiaMiddle AfricaMoldovaMoroccoNepalNetherlandsNicaraguaNigeriaNorth AmericaNorth MacedoniaNorthern AfricaNorthern EuropeNorwayOceaniaPakistanPanamaPeruPhilippinesPolandPortugalRomaniaRussiaSaudi ArabiaScotlandSenegalSerbiaSierra LeoneSingaporeSomaliaSouth AfricaSouth AmericaSouth Central AsiaSouth Eastern AsiaSouthern EuropeSpainSri LankaSt. Vincent and the GrenadinesSudanSwedenSwitzerlandSyriaTaiwanThailandTrinidad and TobagoTurkeyUgandaUkraineUruguayUzbekistanVenezuelaVietnamWest IndiesWestern AfricaWestern AsiaWestern EuropeYemenZaireZimbabweAzores
Mongolian
Race
Ancestry
AfghanAfricanAlaska NativeAlaskan AthabascanAlbanianAleutAlsatianAmericanApacheArabArapahoArgentineanArmenianAssyrian/Chaldean/SyriacAustralianAustrianBahamianBangladeshiBarbadianBasqueBelgianBelizeanBermudanBhutaneseBlackfeetBolivianBrazilianBritishBritish West IndianBulgarianBurmeseCajunCambodianCanadianCape VerdeanCarpatho RusynCelticCentral AmericanCentral American IndianCherokeeCheyenneChickasawChileanChineseChippewaChoctawColombianColvilleComancheCosta RicanCreeCreekCroatianCrowCubanCypriotCzechCzechoslovakianDanishDelawareDominicanDutchDutch West IndianEastern EuropeanEcuadorianEgyptianEnglishEstonianEthiopianEuropeanFijianFilipinoFinnishFrenchFrench American IndianFrench CanadianGermanGerman RussianGhanaianGreekGuamanian/ChamorroGuatemalanGuyaneseHaitianHmongHonduranHopiHoumaHungarianIcelanderIndian (Asian)IndonesianInupiatIranianIraqiIrishIroquoisIsraeliItalianJamaicanJapaneseJordanianKenyanKiowaKoreanLaotianLatvianLebaneseLiberianLithuanianLumbeeLuxembourgerMacedonianMalaysianMalteseMarshalleseMenomineeMexicanMexican American IndianMongolianMoroccanNative HawaiianNavajoNepaleseNew ZealanderNicaraguanNigerianNorthern EuropeanNorwegianOkinawanOsageOttawaPaiutePakistaniPalestinianPanamanianParaguayanPennsylvania GermanPeruvianPimaPolishPortuguesePotawatomiPuebloPuerto RicanPuget Sound SalishRomanianRussianSalvadoranSamoanScandinavianScotch-IrishScottishSeminoleSenegaleseSerbianShoshoneSierra LeoneanSiouxSlavicSlovakSloveneSomaliSouth AfricanSouth AmericanSouth American IndianSoviet UnionSpaniardSpanishSpanish AmericanSpanish American IndianSri LankanSubsaharan AfricanSudaneseSwedishSwissSyrianTaiwaneseThaiTohono O'OdhamTonganTrinidadian and TobagonianTsimshianTurkishU.S. Virgin IslanderUgandanUkrainianUruguayanUteVenezuelanVietnameseWelshWest IndianYakamaYaquiYugoslavianYumanYup'ikZimbabwean
Immigration
NonimmigrantsImmigrantsAfghanistanAfricaAlbaniaArgentinaArmeniaAsiaAustraliaAustriaBahamasBangladeshBarbadosBelarusBelgiumBelizeBoliviaBosnia and HerzegovinaBrazilBulgariaBurma/MyanmarCabo VerdeCambodiaCameroonCanadaCaribbeanCentral AmericaChileChinaColombiaCongoCosta RicaCroatiaCubaCzechoslovakiaDenmarkDominicaDominican RepublicEastern AfricaEastern AsiaEastern EuropeEcuadorEgyptEl SalvadorEnglandEritreaEthiopiaEuropeFijiFranceGermanyGhanaGreeceGrenadaGuatemalaGuyanaHaitiHondurasHong KongHungaryIndiaIndonesiaIranIraqIrelandIsraelItalyJamaicaJapanJordanKazakhstanKenyaKoreaKuwaitLaosLatin AmericaLatviaLebanonLiberiaLithuaniaMalaysiaMexicoMicronesiaMiddle AfricaMoldovaMoroccoNepalNetherlandsNicaraguaNigeriaNorth AmericaNorth MacedoniaNorthern AfricaNorthern EuropeNorwayOceaniaPakistanPanamaPeruPhilippinesPolandPortugalRomaniaRussiaSaudi ArabiaScotlandSenegalSerbiaSierra LeoneSingaporeSomaliaSouth AfricaSouth AmericaSouth Central AsiaSouth Eastern AsiaSouthern EuropeSpainSri LankaSt. Vincent and the GrenadinesSudanSwedenSwitzerlandSyriaTaiwanThailandTrinidad and TobagoTurkeyUgandaUkraineUruguayUzbekistanVenezuelaVietnamWest IndiesWestern AfricaWestern AsiaWestern EuropeYemenZaireZimbabweAzores
Householder Income Under 25 years
Income
Poverty
Unemployment
Labor Participation
Family Structure
Vehicle Availability
Education Level
Disability

Householder Income Under 25 years Comparison

Tlingit-Haida

Mongolians

Exceptional
Good
$55,914
HOUSEHOLDER INCOME UNDER 25 YEARS
100.0/ 100
METRIC RATING
35th/ 347
METRIC RANK
$52,540
HOUSEHOLDER INCOME UNDER 25 YEARS
70.2/ 100
METRIC RATING
159th/ 347
METRIC RANK

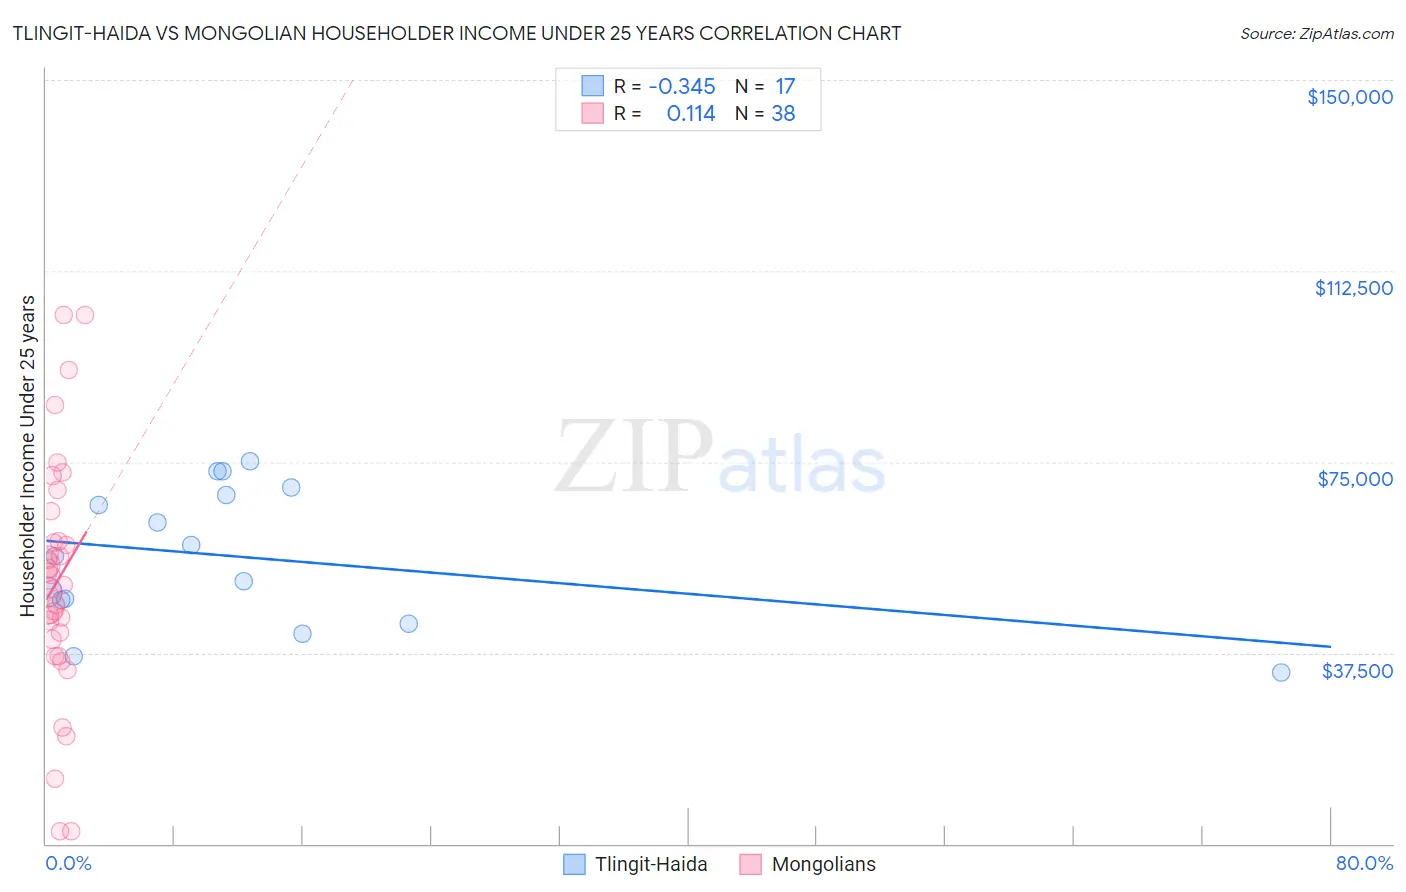
Tlingit-Haida vs Mongolian Householder Income Under 25 years Correlation Chart

The statistical analysis conducted on geographies consisting of 57,369,671 people shows a mild negative correlation between the proportion of Tlingit-Haida and household income with householder under the age of 25 in the United States with a correlation coefficient (R) of -0.345 and weighted average of $55,914. Similarly, the statistical analysis conducted on geographies consisting of 130,351,633 people shows a poor positive correlation between the proportion of Mongolians and household income with householder under the age of 25 in the United States with a correlation coefficient (R) of 0.114 and weighted average of $52,540, a difference of 6.4%.
Tlingit-Haida vs Mongolian Householder Income Under 25 years

Householder Income Under 25 years Correlation Summary

MeasurementTlingit-HaidaMongolian
Minimum$33,750$2,499
Maximum$75,104$103,839
Range$41,354$101,340
Mean$56,260$51,654
Median$56,462$51,754
Interquartile 25% (IQ1)$45,554$40,145
Interquartile 75% (IQ3)$69,196$59,299
Interquartile Range (IQR)$23,642$19,154
Standard Deviation (Sample)$13,469$23,318
Standard Deviation (Population)$13,067$23,009

Similar Demographics by Householder Income Under 25 years

Demographics Similar to Tlingit-Haida by Householder Income Under 25 years

In terms of householder income under 25 years, the demographic groups most similar to Tlingit-Haida are Immigrants from Israel ($55,913, a difference of 0.0%), Immigrants from Japan ($55,932, a difference of 0.030%), Inupiat ($55,935, a difference of 0.040%), Immigrants from Russia ($55,891, a difference of 0.040%), and Immigrants from Iran ($55,880, a difference of 0.060%).
DemographicsRating | RankHouseholder Income Under 25 years
Immigrants | Peru
100.0
/100
|
#28
Exceptional
$56,384
Immigrants | Asia
100.0
/100
|
#29
Exceptional
$56,379
Immigrants | Moldova
100.0
/100
|
#30
Exceptional
$56,168
Vietnamese
100.0
/100
|
#31
Exceptional
$56,127
Peruvians
100.0
/100
|
#32
Exceptional
$56,052
Inupiat
100.0
/100
|
#33
Exceptional
$55,935
Immigrants | Japan
100.0
/100
|
#34
Exceptional
$55,932
Tlingit-Haida
100.0
/100
|
#35
Exceptional
$55,914
Immigrants | Israel
100.0
/100
|
#36
Exceptional
$55,913
Immigrants | Russia
100.0
/100
|
#37
Exceptional
$55,891
Immigrants | Iran
100.0
/100
|
#38
Exceptional
$55,880
Immigrants | Belarus
100.0
/100
|
#39
Exceptional
$55,743
Immigrants | Greece
100.0
/100
|
#40
Exceptional
$55,727
Immigrants | Guyana
100.0
/100
|
#41
Exceptional
$55,726
Immigrants | Korea
100.0
/100
|
#42
Exceptional
$55,716

Demographics Similar to Mongolians by Householder Income Under 25 years

In terms of householder income under 25 years, the demographic groups most similar to Mongolians are Immigrants from Turkey ($52,503, a difference of 0.070%), Ghanaian ($52,594, a difference of 0.10%), Immigrants from Netherlands ($52,592, a difference of 0.10%), Immigrants from Nepal ($52,611, a difference of 0.13%), and Immigrants from Denmark ($52,612, a difference of 0.14%).
DemographicsRating | RankHouseholder Income Under 25 years
Trinidadians and Tobagonians
74.6
/100
|
#152
Good
$52,631
Central Americans
74.4
/100
|
#153
Good
$52,626
Immigrants | Azores
74.2
/100
|
#154
Good
$52,621
Immigrants | Denmark
73.8
/100
|
#155
Good
$52,612
Immigrants | Nepal
73.7
/100
|
#156
Good
$52,611
Ghanaians
72.9
/100
|
#157
Good
$52,594
Immigrants | Netherlands
72.8
/100
|
#158
Good
$52,592
Mongolians
70.2
/100
|
#159
Good
$52,540
Immigrants | Turkey
68.3
/100
|
#160
Good
$52,503
Uruguayans
66.2
/100
|
#161
Good
$52,465
Immigrants | Cambodia
65.4
/100
|
#162
Good
$52,450
Immigrants | Chile
64.8
/100
|
#163
Good
$52,440
Immigrants | Trinidad and Tobago
64.7
/100
|
#164
Good
$52,437
Poles
63.0
/100
|
#165
Good
$52,407
Immigrants | Austria
62.6
/100
|
#166
Good
$52,400