Tlingit-Haida vs Cypriot Householder Income Under 25 years
COMPARE
Tlingit-Haida
Cypriot
Householder Income Under 25 years
Householder Income Under 25 years Comparison
Tlingit-Haida
Cypriots
$55,914
HOUSEHOLDER INCOME UNDER 25 YEARS
100.0/ 100
METRIC RATING
35th/ 347
METRIC RANK
$52,209
HOUSEHOLDER INCOME UNDER 25 YEARS
51.2/ 100
METRIC RATING
172nd/ 347
METRIC RANK
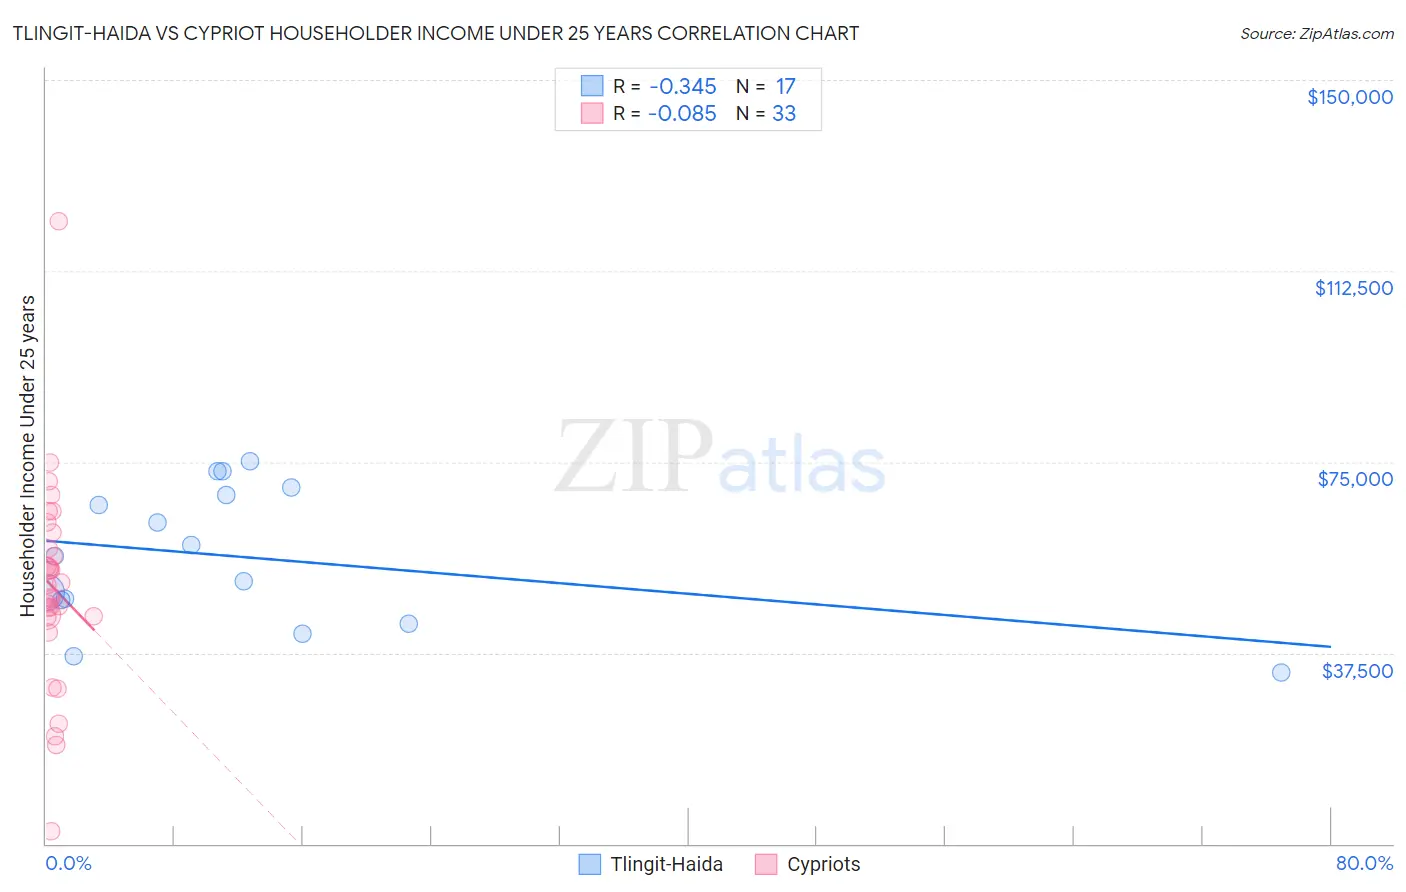
Tlingit-Haida vs Cypriot Householder Income Under 25 years Correlation Chart
The statistical analysis conducted on geographies consisting of 57,369,671 people shows a mild negative correlation between the proportion of Tlingit-Haida and household income with householder under the age of 25 in the United States with a correlation coefficient (R) of -0.345 and weighted average of $55,914. Similarly, the statistical analysis conducted on geographies consisting of 57,005,304 people shows a slight negative correlation between the proportion of Cypriots and household income with householder under the age of 25 in the United States with a correlation coefficient (R) of -0.085 and weighted average of $52,209, a difference of 7.1%.
Householder Income Under 25 years Correlation Summary
| Measurement | Tlingit-Haida | Cypriot |
| Minimum | $33,750 | $2,499 |
| Maximum | $75,104 | $122,212 |
| Range | $41,354 | $119,713 |
| Mean | $56,260 | $50,436 |
| Median | $56,462 | $50,796 |
| Interquartile 25% (IQ1) | $45,554 | $44,534 |
| Interquartile 75% (IQ3) | $69,196 | $59,526 |
| Interquartile Range (IQR) | $23,642 | $14,992 |
| Standard Deviation (Sample) | $13,469 | $20,344 |
| Standard Deviation (Population) | $13,067 | $20,033 |
Similar Demographics by Householder Income Under 25 years
Demographics Similar to Tlingit-Haida by Householder Income Under 25 years
In terms of householder income under 25 years, the demographic groups most similar to Tlingit-Haida are Immigrants from Israel ($55,913, a difference of 0.0%), Immigrants from Japan ($55,932, a difference of 0.030%), Inupiat ($55,935, a difference of 0.040%), Immigrants from Russia ($55,891, a difference of 0.040%), and Immigrants from Iran ($55,880, a difference of 0.060%).
| Demographics | Rating | Rank | Householder Income Under 25 years |
| Immigrants | Peru | 100.0 /100 | #28 | Exceptional $56,384 |
| Immigrants | Asia | 100.0 /100 | #29 | Exceptional $56,379 |
| Immigrants | Moldova | 100.0 /100 | #30 | Exceptional $56,168 |
| Vietnamese | 100.0 /100 | #31 | Exceptional $56,127 |
| Peruvians | 100.0 /100 | #32 | Exceptional $56,052 |
| Inupiat | 100.0 /100 | #33 | Exceptional $55,935 |
| Immigrants | Japan | 100.0 /100 | #34 | Exceptional $55,932 |
| Tlingit-Haida | 100.0 /100 | #35 | Exceptional $55,914 |
| Immigrants | Israel | 100.0 /100 | #36 | Exceptional $55,913 |
| Immigrants | Russia | 100.0 /100 | #37 | Exceptional $55,891 |
| Immigrants | Iran | 100.0 /100 | #38 | Exceptional $55,880 |
| Immigrants | Belarus | 100.0 /100 | #39 | Exceptional $55,743 |
| Immigrants | Greece | 100.0 /100 | #40 | Exceptional $55,727 |
| Immigrants | Guyana | 100.0 /100 | #41 | Exceptional $55,726 |
| Immigrants | Korea | 100.0 /100 | #42 | Exceptional $55,716 |
Demographics Similar to Cypriots by Householder Income Under 25 years
In terms of householder income under 25 years, the demographic groups most similar to Cypriots are Barbadian ($52,202, a difference of 0.010%), Immigrants from Western Asia ($52,190, a difference of 0.040%), Immigrants from Uruguay ($52,302, a difference of 0.18%), Canadian ($52,336, a difference of 0.24%), and Israeli ($52,335, a difference of 0.24%).
| Demographics | Rating | Rank | Householder Income Under 25 years |
| Poles | 63.0 /100 | #165 | Good $52,407 |
| Immigrants | Austria | 62.6 /100 | #166 | Good $52,400 |
| Immigrants | Uganda | 61.1 /100 | #167 | Good $52,374 |
| Japanese | 60.5 /100 | #168 | Good $52,365 |
| Canadians | 58.8 /100 | #169 | Average $52,336 |
| Israelis | 58.8 /100 | #170 | Average $52,335 |
| Immigrants | Uruguay | 56.8 /100 | #171 | Average $52,302 |
| Cypriots | 51.2 /100 | #172 | Average $52,209 |
| Barbadians | 50.8 /100 | #173 | Average $52,202 |
| Immigrants | Western Asia | 50.0 /100 | #174 | Average $52,190 |
| Immigrants | Zimbabwe | 33.8 /100 | #175 | Fair $51,914 |
| Austrians | 32.9 /100 | #176 | Fair $51,898 |
| British West Indians | 30.0 /100 | #177 | Fair $51,844 |
| Finns | 29.2 /100 | #178 | Fair $51,827 |
| Basques | 28.7 /100 | #179 | Fair $51,818 |