Tlingit-Haida vs Paiute Householder Income Under 25 years
COMPARE
Tlingit-Haida
Paiute
Householder Income Under 25 years
Householder Income Under 25 years Comparison
Tlingit-Haida
Paiute
$55,914
HOUSEHOLDER INCOME UNDER 25 YEARS
100.0/ 100
METRIC RATING
35th/ 347
METRIC RANK
$51,743
HOUSEHOLDER INCOME UNDER 25 YEARS
25.1/ 100
METRIC RATING
184th/ 347
METRIC RANK
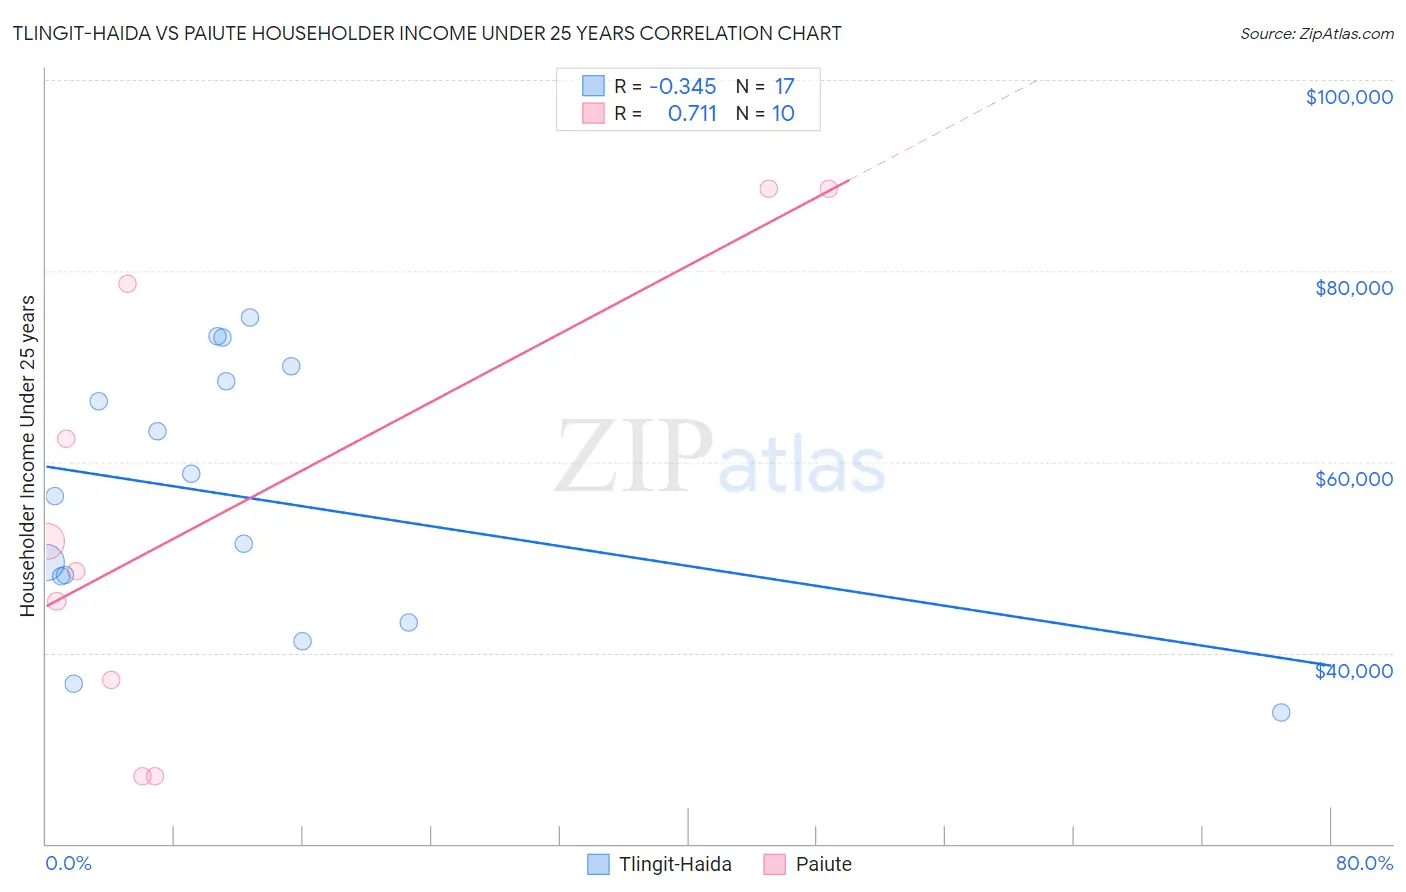
Tlingit-Haida vs Paiute Householder Income Under 25 years Correlation Chart
The statistical analysis conducted on geographies consisting of 57,369,671 people shows a mild negative correlation between the proportion of Tlingit-Haida and household income with householder under the age of 25 in the United States with a correlation coefficient (R) of -0.345 and weighted average of $55,914. Similarly, the statistical analysis conducted on geographies consisting of 55,798,660 people shows a strong positive correlation between the proportion of Paiute and household income with householder under the age of 25 in the United States with a correlation coefficient (R) of 0.711 and weighted average of $51,743, a difference of 8.1%.
Householder Income Under 25 years Correlation Summary
| Measurement | Tlingit-Haida | Paiute |
| Minimum | $33,750 | $27,120 |
| Maximum | $75,104 | $88,654 |
| Range | $41,354 | $61,534 |
| Mean | $56,260 | $55,543 |
| Median | $56,462 | $50,117 |
| Interquartile 25% (IQ1) | $45,554 | $37,118 |
| Interquartile 75% (IQ3) | $69,196 | $78,623 |
| Interquartile Range (IQR) | $23,642 | $41,505 |
| Standard Deviation (Sample) | $13,469 | $23,320 |
| Standard Deviation (Population) | $13,067 | $22,123 |
Similar Demographics by Householder Income Under 25 years
Demographics Similar to Tlingit-Haida by Householder Income Under 25 years
In terms of householder income under 25 years, the demographic groups most similar to Tlingit-Haida are Immigrants from Israel ($55,913, a difference of 0.0%), Immigrants from Japan ($55,932, a difference of 0.030%), Inupiat ($55,935, a difference of 0.040%), Immigrants from Russia ($55,891, a difference of 0.040%), and Immigrants from Iran ($55,880, a difference of 0.060%).
| Demographics | Rating | Rank | Householder Income Under 25 years |
| Immigrants | Peru | 100.0 /100 | #28 | Exceptional $56,384 |
| Immigrants | Asia | 100.0 /100 | #29 | Exceptional $56,379 |
| Immigrants | Moldova | 100.0 /100 | #30 | Exceptional $56,168 |
| Vietnamese | 100.0 /100 | #31 | Exceptional $56,127 |
| Peruvians | 100.0 /100 | #32 | Exceptional $56,052 |
| Inupiat | 100.0 /100 | #33 | Exceptional $55,935 |
| Immigrants | Japan | 100.0 /100 | #34 | Exceptional $55,932 |
| Tlingit-Haida | 100.0 /100 | #35 | Exceptional $55,914 |
| Immigrants | Israel | 100.0 /100 | #36 | Exceptional $55,913 |
| Immigrants | Russia | 100.0 /100 | #37 | Exceptional $55,891 |
| Immigrants | Iran | 100.0 /100 | #38 | Exceptional $55,880 |
| Immigrants | Belarus | 100.0 /100 | #39 | Exceptional $55,743 |
| Immigrants | Greece | 100.0 /100 | #40 | Exceptional $55,727 |
| Immigrants | Guyana | 100.0 /100 | #41 | Exceptional $55,726 |
| Immigrants | Korea | 100.0 /100 | #42 | Exceptional $55,716 |
Demographics Similar to Paiute by Householder Income Under 25 years
In terms of householder income under 25 years, the demographic groups most similar to Paiute are Immigrants from Latvia ($51,737, a difference of 0.010%), Alaskan Athabascan ($51,713, a difference of 0.060%), Immigrants from South Africa ($51,705, a difference of 0.070%), Mexican American Indian ($51,783, a difference of 0.080%), and European ($51,796, a difference of 0.10%).
| Demographics | Rating | Rank | Householder Income Under 25 years |
| British West Indians | 30.0 /100 | #177 | Fair $51,844 |
| Finns | 29.2 /100 | #178 | Fair $51,827 |
| Basques | 28.7 /100 | #179 | Fair $51,818 |
| Immigrants | England | 28.7 /100 | #180 | Fair $51,817 |
| Europeans | 27.6 /100 | #181 | Fair $51,796 |
| Jordanians | 27.6 /100 | #182 | Fair $51,796 |
| Mexican American Indians | 27.0 /100 | #183 | Fair $51,783 |
| Paiute | 25.1 /100 | #184 | Fair $51,743 |
| Immigrants | Latvia | 24.8 /100 | #185 | Fair $51,737 |
| Alaskan Athabascans | 23.8 /100 | #186 | Fair $51,713 |
| Immigrants | South Africa | 23.4 /100 | #187 | Fair $51,705 |
| Northern Europeans | 22.2 /100 | #188 | Fair $51,678 |
| Croatians | 21.6 /100 | #189 | Fair $51,662 |
| Malaysians | 19.7 /100 | #190 | Poor $51,615 |
| Panamanians | 19.5 /100 | #191 | Poor $51,611 |