Belgian vs Mongolian Householder Income Under 25 years
COMPARE
Belgian
Mongolian
Householder Income Under 25 years
Householder Income Under 25 years Comparison
Belgians
Mongolians
$50,113
HOUSEHOLDER INCOME UNDER 25 YEARS
0.6/ 100
METRIC RATING
265th/ 347
METRIC RANK
$52,540
HOUSEHOLDER INCOME UNDER 25 YEARS
70.2/ 100
METRIC RATING
159th/ 347
METRIC RANK
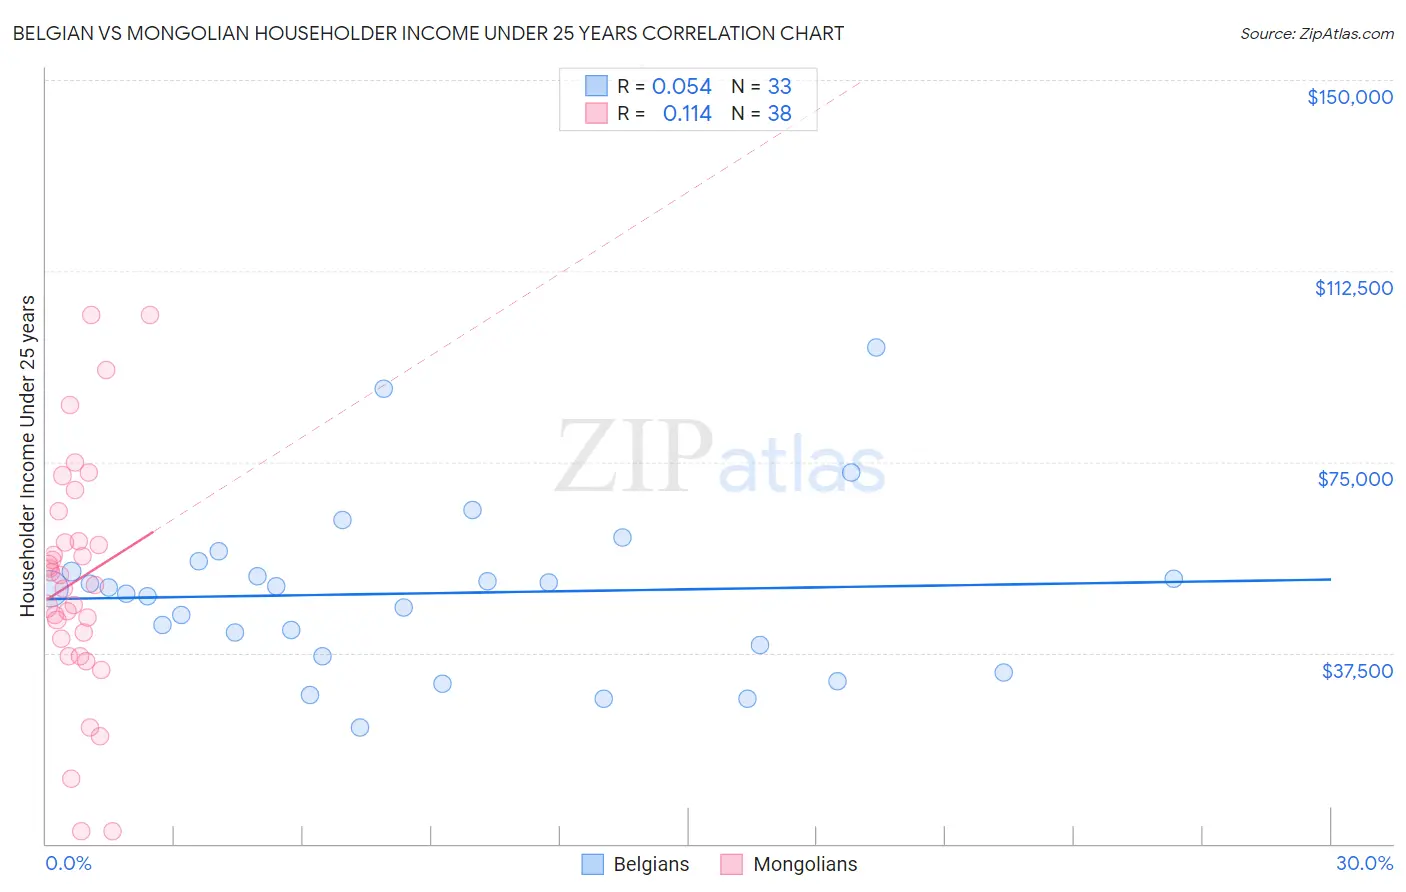
Belgian vs Mongolian Householder Income Under 25 years Correlation Chart
The statistical analysis conducted on geographies consisting of 302,930,390 people shows a slight positive correlation between the proportion of Belgians and household income with householder under the age of 25 in the United States with a correlation coefficient (R) of 0.054 and weighted average of $50,113. Similarly, the statistical analysis conducted on geographies consisting of 130,351,633 people shows a poor positive correlation between the proportion of Mongolians and household income with householder under the age of 25 in the United States with a correlation coefficient (R) of 0.114 and weighted average of $52,540, a difference of 4.8%.
Householder Income Under 25 years Correlation Summary
| Measurement | Belgian | Mongolian |
| Minimum | $22,948 | $2,499 |
| Maximum | $97,500 | $103,839 |
| Range | $74,552 | $101,340 |
| Mean | $49,189 | $51,654 |
| Median | $50,156 | $51,754 |
| Interquartile 25% (IQ1) | $38,023 | $40,145 |
| Interquartile 75% (IQ3) | $54,461 | $59,299 |
| Interquartile Range (IQR) | $16,438 | $19,154 |
| Standard Deviation (Sample) | $16,294 | $23,318 |
| Standard Deviation (Population) | $16,045 | $23,009 |
Similar Demographics by Householder Income Under 25 years
Demographics Similar to Belgians by Householder Income Under 25 years
In terms of householder income under 25 years, the demographic groups most similar to Belgians are Immigrants from Venezuela ($50,109, a difference of 0.010%), Fijian ($50,132, a difference of 0.040%), Immigrants from Laos ($50,041, a difference of 0.14%), Immigrants from Dominican Republic ($50,204, a difference of 0.18%), and Venezuelan ($50,011, a difference of 0.20%).
| Demographics | Rating | Rank | Householder Income Under 25 years |
| Whites/Caucasians | 1.1 /100 | #258 | Tragic $50,336 |
| Immigrants | Dominica | 1.0 /100 | #259 | Tragic $50,301 |
| Hispanics or Latinos | 0.9 /100 | #260 | Tragic $50,279 |
| Hungarians | 0.9 /100 | #261 | Tragic $50,247 |
| Haitians | 0.8 /100 | #262 | Tragic $50,231 |
| Immigrants | Dominican Republic | 0.8 /100 | #263 | Tragic $50,204 |
| Fijians | 0.6 /100 | #264 | Tragic $50,132 |
| Belgians | 0.6 /100 | #265 | Tragic $50,113 |
| Immigrants | Venezuela | 0.6 /100 | #266 | Tragic $50,109 |
| Immigrants | Laos | 0.5 /100 | #267 | Tragic $50,041 |
| Venezuelans | 0.5 /100 | #268 | Tragic $50,011 |
| Ute | 0.5 /100 | #269 | Tragic $49,997 |
| Mexicans | 0.5 /100 | #270 | Tragic $49,989 |
| Taiwanese | 0.3 /100 | #271 | Tragic $49,804 |
| Colville | 0.3 /100 | #272 | Tragic $49,774 |
Demographics Similar to Mongolians by Householder Income Under 25 years
In terms of householder income under 25 years, the demographic groups most similar to Mongolians are Immigrants from Turkey ($52,503, a difference of 0.070%), Ghanaian ($52,594, a difference of 0.10%), Immigrants from Netherlands ($52,592, a difference of 0.10%), Immigrants from Nepal ($52,611, a difference of 0.13%), and Immigrants from Denmark ($52,612, a difference of 0.14%).
| Demographics | Rating | Rank | Householder Income Under 25 years |
| Trinidadians and Tobagonians | 74.6 /100 | #152 | Good $52,631 |
| Central Americans | 74.4 /100 | #153 | Good $52,626 |
| Immigrants | Azores | 74.2 /100 | #154 | Good $52,621 |
| Immigrants | Denmark | 73.8 /100 | #155 | Good $52,612 |
| Immigrants | Nepal | 73.7 /100 | #156 | Good $52,611 |
| Ghanaians | 72.9 /100 | #157 | Good $52,594 |
| Immigrants | Netherlands | 72.8 /100 | #158 | Good $52,592 |
| Mongolians | 70.2 /100 | #159 | Good $52,540 |
| Immigrants | Turkey | 68.3 /100 | #160 | Good $52,503 |
| Uruguayans | 66.2 /100 | #161 | Good $52,465 |
| Immigrants | Cambodia | 65.4 /100 | #162 | Good $52,450 |
| Immigrants | Chile | 64.8 /100 | #163 | Good $52,440 |
| Immigrants | Trinidad and Tobago | 64.7 /100 | #164 | Good $52,437 |
| Poles | 63.0 /100 | #165 | Good $52,407 |
| Immigrants | Austria | 62.6 /100 | #166 | Good $52,400 |