Basque vs Mongolian Householder Income Under 25 years
COMPARE
Basque
Mongolian
Householder Income Under 25 years
Householder Income Under 25 years Comparison
Basques
Mongolians
$51,818
HOUSEHOLDER INCOME UNDER 25 YEARS
28.7/ 100
METRIC RATING
179th/ 347
METRIC RANK
$52,540
HOUSEHOLDER INCOME UNDER 25 YEARS
70.2/ 100
METRIC RATING
159th/ 347
METRIC RANK
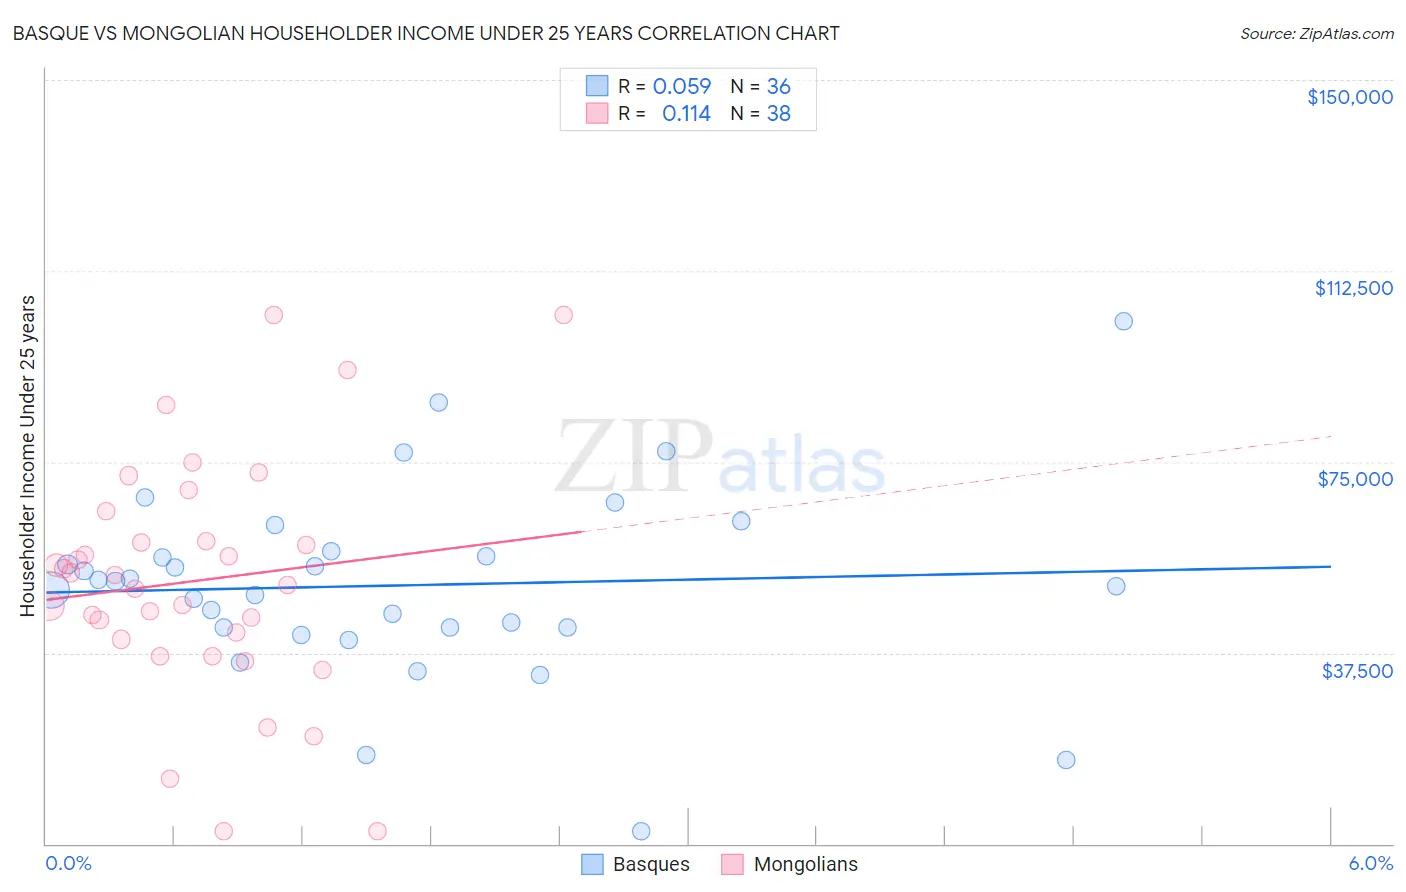
Basque vs Mongolian Householder Income Under 25 years Correlation Chart
The statistical analysis conducted on geographies consisting of 150,470,648 people shows a slight positive correlation between the proportion of Basques and household income with householder under the age of 25 in the United States with a correlation coefficient (R) of 0.059 and weighted average of $51,818. Similarly, the statistical analysis conducted on geographies consisting of 130,351,633 people shows a poor positive correlation between the proportion of Mongolians and household income with householder under the age of 25 in the United States with a correlation coefficient (R) of 0.114 and weighted average of $52,540, a difference of 1.4%.
Householder Income Under 25 years Correlation Summary
| Measurement | Basque | Mongolian |
| Minimum | $2,499 | $2,499 |
| Maximum | $102,571 | $103,839 |
| Range | $100,072 | $101,340 |
| Mean | $50,731 | $51,654 |
| Median | $51,007 | $51,754 |
| Interquartile 25% (IQ1) | $42,540 | $40,145 |
| Interquartile 75% (IQ3) | $57,010 | $59,299 |
| Interquartile Range (IQR) | $14,470 | $19,154 |
| Standard Deviation (Sample) | $18,783 | $23,318 |
| Standard Deviation (Population) | $18,521 | $23,009 |
Demographics Similar to Basques and Mongolians by Householder Income Under 25 years
In terms of householder income under 25 years, the demographic groups most similar to Basques are Finnish ($51,827, a difference of 0.020%), British West Indian ($51,844, a difference of 0.050%), Austrian ($51,898, a difference of 0.15%), Immigrants from Zimbabwe ($51,914, a difference of 0.19%), and Immigrants from Western Asia ($52,190, a difference of 0.72%). Similarly, the demographic groups most similar to Mongolians are Immigrants from Turkey ($52,503, a difference of 0.070%), Uruguayan ($52,465, a difference of 0.14%), Immigrants from Cambodia ($52,450, a difference of 0.17%), Immigrants from Chile ($52,440, a difference of 0.19%), and Immigrants from Trinidad and Tobago ($52,437, a difference of 0.20%).
| Demographics | Rating | Rank | Householder Income Under 25 years |
| Mongolians | 70.2 /100 | #159 | Good $52,540 |
| Immigrants | Turkey | 68.3 /100 | #160 | Good $52,503 |
| Uruguayans | 66.2 /100 | #161 | Good $52,465 |
| Immigrants | Cambodia | 65.4 /100 | #162 | Good $52,450 |
| Immigrants | Chile | 64.8 /100 | #163 | Good $52,440 |
| Immigrants | Trinidad and Tobago | 64.7 /100 | #164 | Good $52,437 |
| Poles | 63.0 /100 | #165 | Good $52,407 |
| Immigrants | Austria | 62.6 /100 | #166 | Good $52,400 |
| Immigrants | Uganda | 61.1 /100 | #167 | Good $52,374 |
| Japanese | 60.5 /100 | #168 | Good $52,365 |
| Canadians | 58.8 /100 | #169 | Average $52,336 |
| Israelis | 58.8 /100 | #170 | Average $52,335 |
| Immigrants | Uruguay | 56.8 /100 | #171 | Average $52,302 |
| Cypriots | 51.2 /100 | #172 | Average $52,209 |
| Barbadians | 50.8 /100 | #173 | Average $52,202 |
| Immigrants | Western Asia | 50.0 /100 | #174 | Average $52,190 |
| Immigrants | Zimbabwe | 33.8 /100 | #175 | Fair $51,914 |
| Austrians | 32.9 /100 | #176 | Fair $51,898 |
| British West Indians | 30.0 /100 | #177 | Fair $51,844 |
| Finns | 29.2 /100 | #178 | Fair $51,827 |
| Basques | 28.7 /100 | #179 | Fair $51,818 |