Tlingit-Haida vs Mongolian Child Poverty Under the Age of 16
COMPARE
Tlingit-Haida
Mongolian
Child Poverty Under the Age of 16
Child Poverty Under the Age of 16 Comparison
Tlingit-Haida
Mongolians
14.9%
CHILD POVERTY UNDER THE AGE OF 16
94.1/ 100
METRIC RATING
109th/ 347
METRIC RANK
15.2%
CHILD POVERTY UNDER THE AGE OF 16
89.5/ 100
METRIC RATING
130th/ 347
METRIC RANK
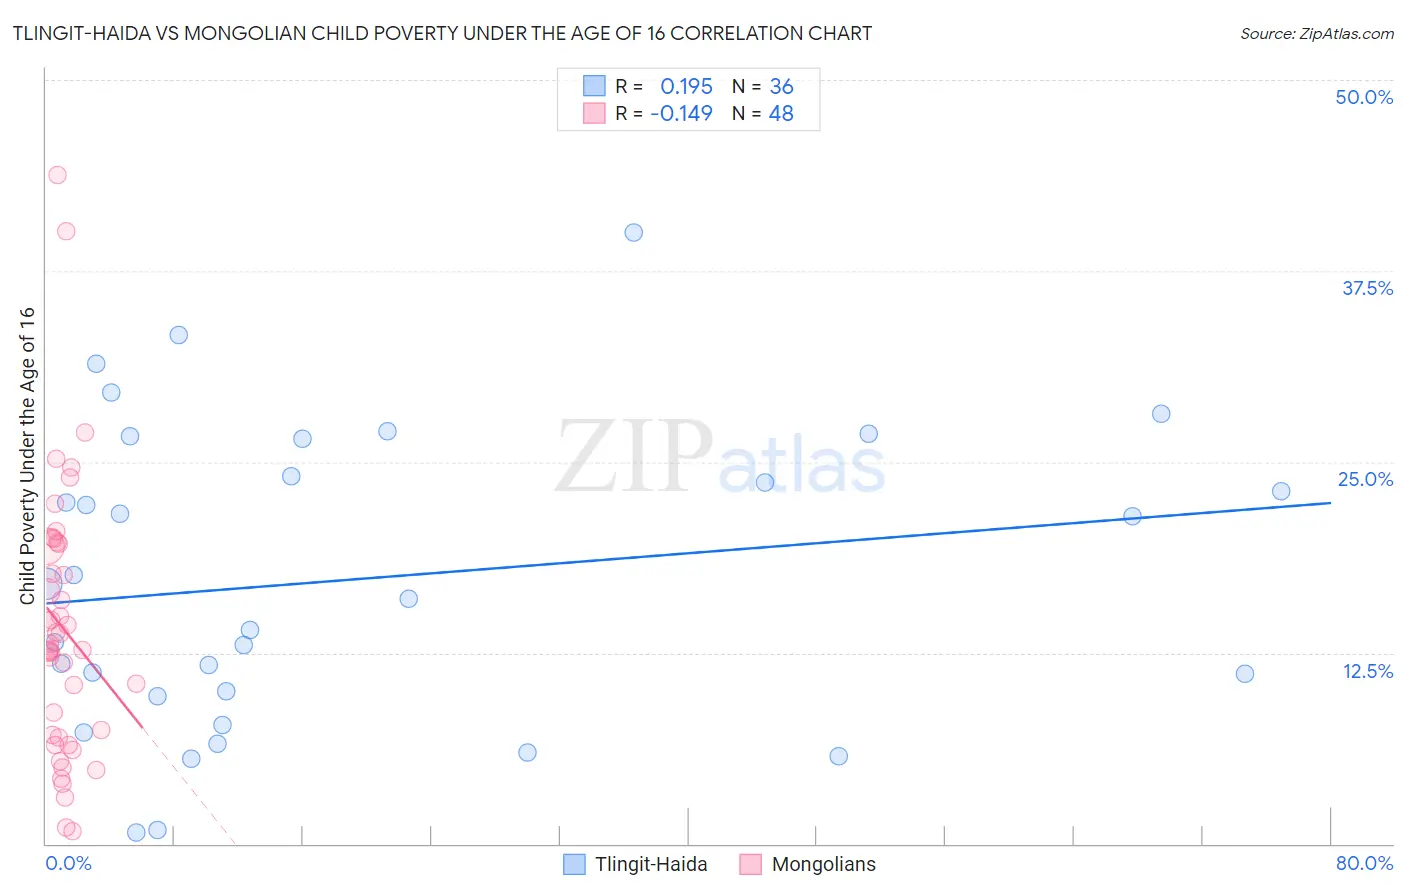
Tlingit-Haida vs Mongolian Child Poverty Under the Age of 16 Correlation Chart
The statistical analysis conducted on geographies consisting of 60,748,719 people shows a poor positive correlation between the proportion of Tlingit-Haida and poverty level among children under the age of 16 in the United States with a correlation coefficient (R) of 0.195 and weighted average of 14.9%. Similarly, the statistical analysis conducted on geographies consisting of 140,038,106 people shows a poor negative correlation between the proportion of Mongolians and poverty level among children under the age of 16 in the United States with a correlation coefficient (R) of -0.149 and weighted average of 15.2%, a difference of 2.1%.
Child Poverty Under the Age of 16 Correlation Summary
| Measurement | Tlingit-Haida | Mongolian |
| Minimum | 0.72% | 0.81% |
| Maximum | 40.0% | 43.8% |
| Range | 39.3% | 43.0% |
| Mean | 17.4% | 14.1% |
| Median | 16.5% | 12.9% |
| Interquartile 25% (IQ1) | 9.8% | 7.0% |
| Interquartile 75% (IQ3) | 25.3% | 19.6% |
| Interquartile Range (IQR) | 15.5% | 12.5% |
| Standard Deviation (Sample) | 9.8% | 8.8% |
| Standard Deviation (Population) | 9.6% | 8.7% |
Similar Demographics by Child Poverty Under the Age of 16
Demographics Similar to Tlingit-Haida by Child Poverty Under the Age of 16
In terms of child poverty under the age of 16, the demographic groups most similar to Tlingit-Haida are Jordanian (14.8%, a difference of 0.070%), Chilean (14.8%, a difference of 0.16%), Serbian (14.8%, a difference of 0.22%), English (14.9%, a difference of 0.34%), and Basque (14.8%, a difference of 0.35%).
| Demographics | Rating | Rank | Child Poverty Under the Age of 16 |
| Romanians | 95.0 /100 | #102 | Exceptional 14.8% |
| Immigrants | Egypt | 94.9 /100 | #103 | Exceptional 14.8% |
| Immigrants | England | 94.8 /100 | #104 | Exceptional 14.8% |
| Basques | 94.7 /100 | #105 | Exceptional 14.8% |
| Serbians | 94.5 /100 | #106 | Exceptional 14.8% |
| Chileans | 94.4 /100 | #107 | Exceptional 14.8% |
| Jordanians | 94.2 /100 | #108 | Exceptional 14.8% |
| Tlingit-Haida | 94.1 /100 | #109 | Exceptional 14.9% |
| English | 93.5 /100 | #110 | Exceptional 14.9% |
| Immigrants | Denmark | 93.5 /100 | #111 | Exceptional 14.9% |
| Irish | 93.4 /100 | #112 | Exceptional 14.9% |
| Belgians | 93.3 /100 | #113 | Exceptional 14.9% |
| Sri Lankans | 93.2 /100 | #114 | Exceptional 14.9% |
| Immigrants | Ukraine | 93.1 /100 | #115 | Exceptional 14.9% |
| Carpatho Rusyns | 93.1 /100 | #116 | Exceptional 14.9% |
Demographics Similar to Mongolians by Child Poverty Under the Age of 16
In terms of child poverty under the age of 16, the demographic groups most similar to Mongolians are Armenian (15.2%, a difference of 0.030%), Immigrants from Southern Europe (15.1%, a difference of 0.10%), Canadian (15.2%, a difference of 0.12%), Immigrants from South Eastern Asia (15.2%, a difference of 0.17%), and Immigrants from Kazakhstan (15.1%, a difference of 0.25%).
| Demographics | Rating | Rank | Child Poverty Under the Age of 16 |
| Immigrants | Brazil | 91.1 /100 | #123 | Exceptional 15.1% |
| Czechoslovakians | 91.0 /100 | #124 | Exceptional 15.1% |
| Palestinians | 90.9 /100 | #125 | Exceptional 15.1% |
| Portuguese | 90.6 /100 | #126 | Exceptional 15.1% |
| Immigrants | Western Europe | 90.3 /100 | #127 | Exceptional 15.1% |
| Immigrants | Kazakhstan | 90.2 /100 | #128 | Exceptional 15.1% |
| Immigrants | Southern Europe | 89.7 /100 | #129 | Excellent 15.1% |
| Mongolians | 89.5 /100 | #130 | Excellent 15.2% |
| Armenians | 89.4 /100 | #131 | Excellent 15.2% |
| Canadians | 89.1 /100 | #132 | Excellent 15.2% |
| Immigrants | South Eastern Asia | 89.0 /100 | #133 | Excellent 15.2% |
| Native Hawaiians | 88.7 /100 | #134 | Excellent 15.2% |
| Albanians | 88.6 /100 | #135 | Excellent 15.2% |
| Immigrants | Spain | 87.3 /100 | #136 | Excellent 15.3% |
| Peruvians | 87.2 /100 | #137 | Excellent 15.3% |