Tlingit-Haida vs Mongolian Disability Age 18 to 34
COMPARE
Tlingit-Haida
Mongolian
Disability Age 18 to 34
Disability Age 18 to 34 Comparison
Tlingit-Haida
Mongolians
7.7%
DISABILITY AGE 18 TO 34
0.0/ 100
METRIC RATING
295th/ 347
METRIC RANK
6.2%
DISABILITY AGE 18 TO 34
96.2/ 100
METRIC RATING
104th/ 347
METRIC RANK
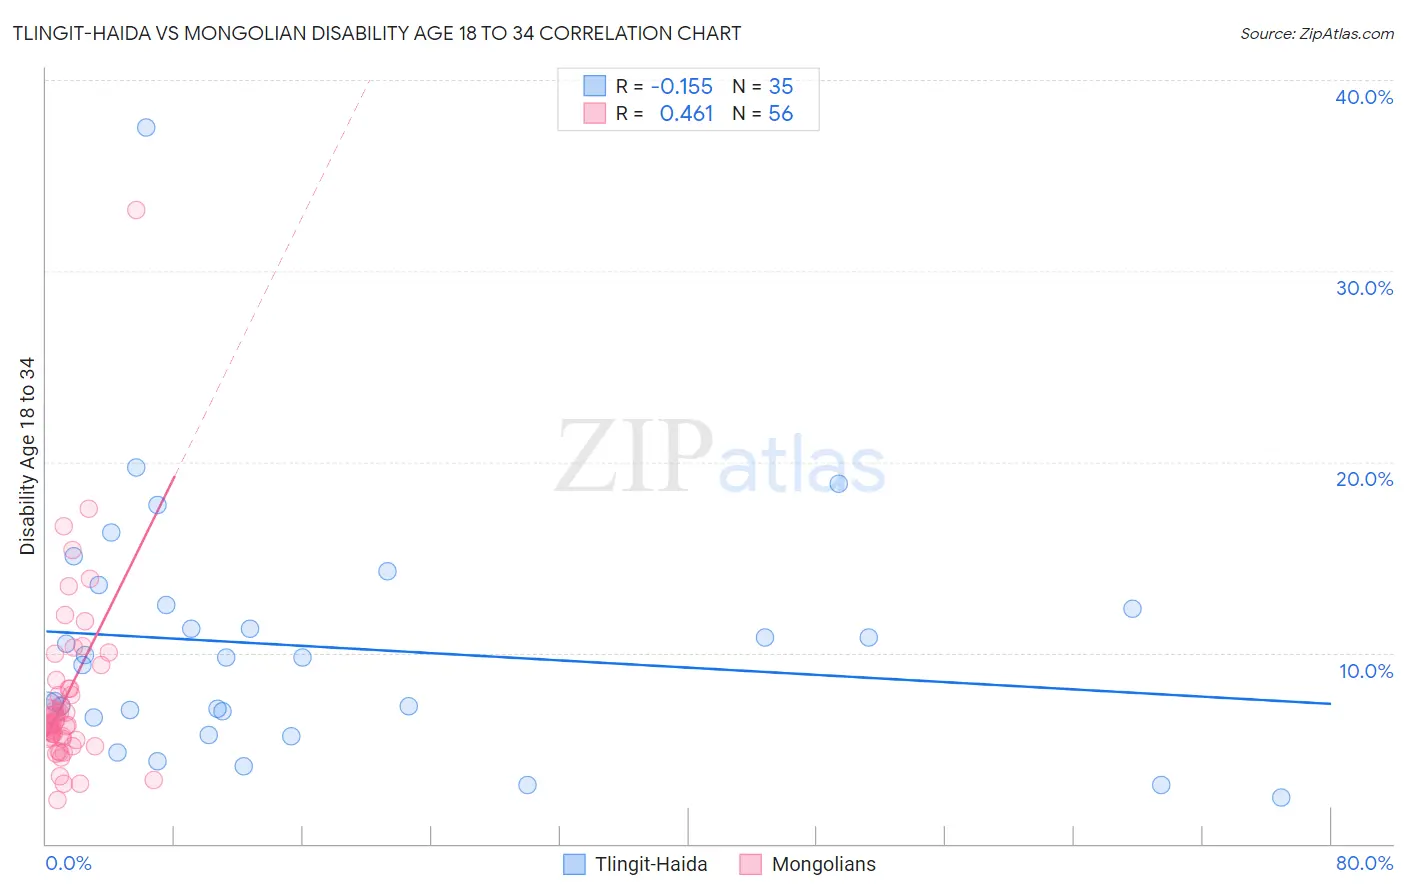
Tlingit-Haida vs Mongolian Disability Age 18 to 34 Correlation Chart
The statistical analysis conducted on geographies consisting of 60,778,142 people shows a poor negative correlation between the proportion of Tlingit-Haida and percentage of population with a disability between the ages 18 and 35 in the United States with a correlation coefficient (R) of -0.155 and weighted average of 7.7%. Similarly, the statistical analysis conducted on geographies consisting of 140,283,561 people shows a moderate positive correlation between the proportion of Mongolians and percentage of population with a disability between the ages 18 and 35 in the United States with a correlation coefficient (R) of 0.461 and weighted average of 6.2%, a difference of 23.4%.
Disability Age 18 to 34 Correlation Summary
| Measurement | Tlingit-Haida | Mongolian |
| Minimum | 2.4% | 2.3% |
| Maximum | 37.5% | 33.2% |
| Range | 35.1% | 30.9% |
| Mean | 10.3% | 7.8% |
| Median | 9.7% | 6.3% |
| Interquartile 25% (IQ1) | 6.6% | 5.5% |
| Interquartile 75% (IQ3) | 12.5% | 8.4% |
| Interquartile Range (IQR) | 5.9% | 2.8% |
| Standard Deviation (Sample) | 6.5% | 4.8% |
| Standard Deviation (Population) | 6.4% | 4.7% |
Similar Demographics by Disability Age 18 to 34
Demographics Similar to Tlingit-Haida by Disability Age 18 to 34
In terms of disability age 18 to 34, the demographic groups most similar to Tlingit-Haida are Immigrants from Cabo Verde (7.7%, a difference of 0.010%), Scandinavian (7.7%, a difference of 0.16%), Cape Verdean (7.7%, a difference of 0.18%), Pueblo (7.7%, a difference of 0.19%), and Black/African American (7.7%, a difference of 0.22%).
| Demographics | Rating | Rank | Disability Age 18 to 34 |
| Whites/Caucasians | 0.0 /100 | #288 | Tragic 7.6% |
| Immigrants | Nonimmigrants | 0.0 /100 | #289 | Tragic 7.6% |
| Slovaks | 0.0 /100 | #290 | Tragic 7.7% |
| Irish | 0.0 /100 | #291 | Tragic 7.7% |
| Blacks/African Americans | 0.0 /100 | #292 | Tragic 7.7% |
| Scandinavians | 0.0 /100 | #293 | Tragic 7.7% |
| Immigrants | Cabo Verde | 0.0 /100 | #294 | Tragic 7.7% |
| Tlingit-Haida | 0.0 /100 | #295 | Tragic 7.7% |
| Cape Verdeans | 0.0 /100 | #296 | Tragic 7.7% |
| Pueblo | 0.0 /100 | #297 | Tragic 7.7% |
| Dutch | 0.0 /100 | #298 | Tragic 7.7% |
| Germans | 0.0 /100 | #299 | Tragic 7.7% |
| Scottish | 0.0 /100 | #300 | Tragic 7.7% |
| Pima | 0.0 /100 | #301 | Tragic 7.7% |
| Welsh | 0.0 /100 | #302 | Tragic 7.7% |
Demographics Similar to Mongolians by Disability Age 18 to 34
In terms of disability age 18 to 34, the demographic groups most similar to Mongolians are Bhutanese (6.2%, a difference of 0.0%), Laotian (6.2%, a difference of 0.090%), Immigrants from Bulgaria (6.2%, a difference of 0.090%), Immigrants from Jamaica (6.2%, a difference of 0.12%), and Immigrants from Afghanistan (6.2%, a difference of 0.15%).
| Demographics | Rating | Rank | Disability Age 18 to 34 |
| Uruguayans | 97.3 /100 | #97 | Exceptional 6.2% |
| Immigrants | Syria | 97.2 /100 | #98 | Exceptional 6.2% |
| Immigrants | Ethiopia | 96.9 /100 | #99 | Exceptional 6.2% |
| Immigrants | Albania | 96.7 /100 | #100 | Exceptional 6.2% |
| Immigrants | Jamaica | 96.4 /100 | #101 | Exceptional 6.2% |
| Laotians | 96.4 /100 | #102 | Exceptional 6.2% |
| Immigrants | Bulgaria | 96.3 /100 | #103 | Exceptional 6.2% |
| Mongolians | 96.2 /100 | #104 | Exceptional 6.2% |
| Bhutanese | 96.2 /100 | #105 | Exceptional 6.2% |
| Immigrants | Afghanistan | 95.9 /100 | #106 | Exceptional 6.2% |
| Ethiopians | 95.8 /100 | #107 | Exceptional 6.2% |
| Immigrants | Croatia | 95.7 /100 | #108 | Exceptional 6.2% |
| Sri Lankans | 95.5 /100 | #109 | Exceptional 6.2% |
| Immigrants | Brazil | 95.2 /100 | #110 | Exceptional 6.3% |
| Immigrants | France | 95.1 /100 | #111 | Exceptional 6.3% |