Tlingit-Haida vs Bangladeshi Householder Income Under 25 years
COMPARE
Tlingit-Haida
Bangladeshi
Householder Income Under 25 years
Householder Income Under 25 years Comparison
Tlingit-Haida
Bangladeshis
$55,914
HOUSEHOLDER INCOME UNDER 25 YEARS
100.0/ 100
METRIC RATING
35th/ 347
METRIC RANK
$47,589
HOUSEHOLDER INCOME UNDER 25 YEARS
0.0/ 100
METRIC RATING
307th/ 347
METRIC RANK
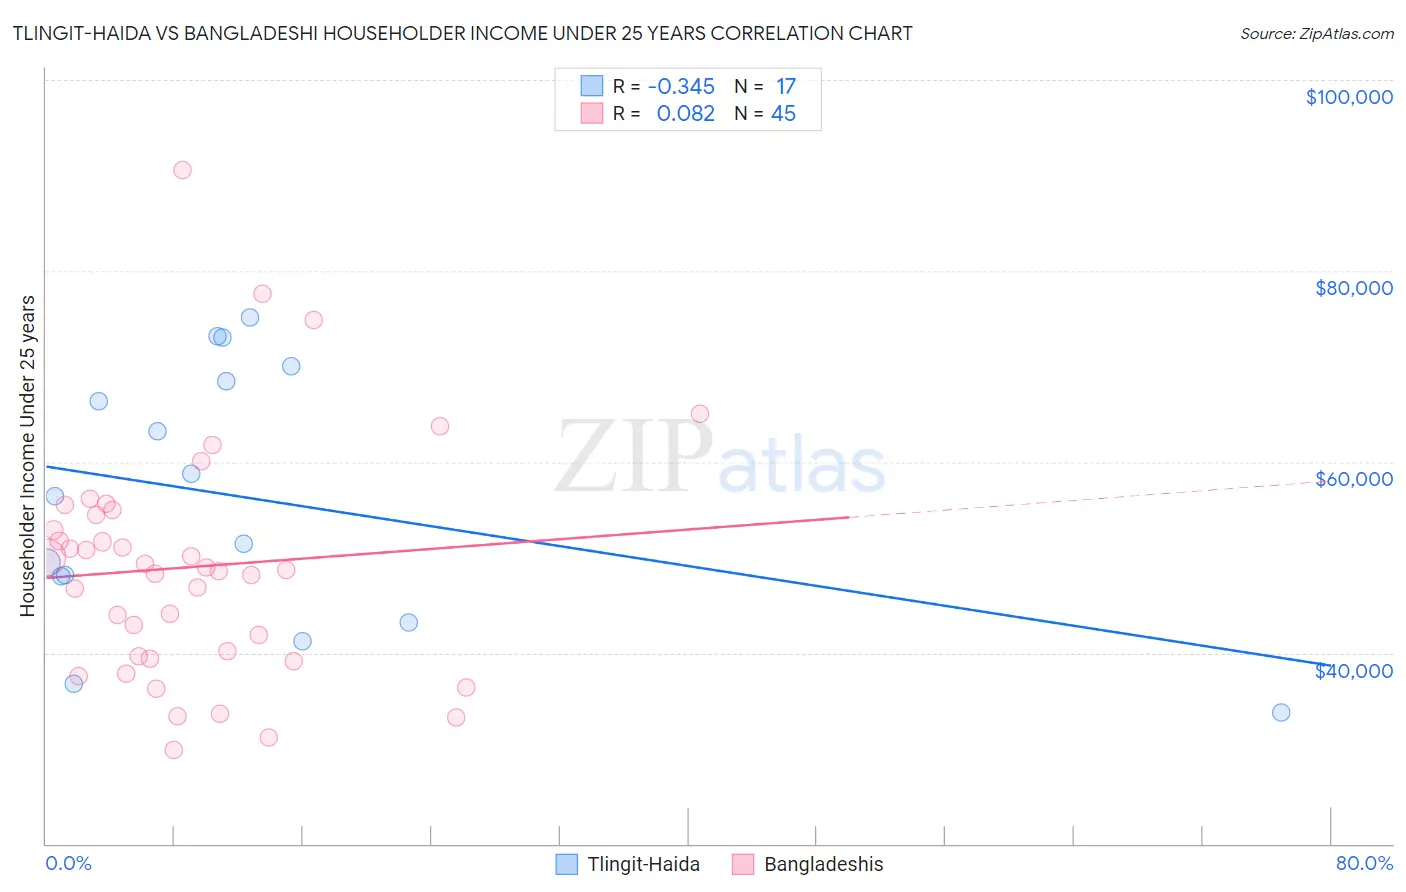
Tlingit-Haida vs Bangladeshi Householder Income Under 25 years Correlation Chart
The statistical analysis conducted on geographies consisting of 57,369,671 people shows a mild negative correlation between the proportion of Tlingit-Haida and household income with householder under the age of 25 in the United States with a correlation coefficient (R) of -0.345 and weighted average of $55,914. Similarly, the statistical analysis conducted on geographies consisting of 131,389,647 people shows a slight positive correlation between the proportion of Bangladeshis and household income with householder under the age of 25 in the United States with a correlation coefficient (R) of 0.082 and weighted average of $47,589, a difference of 17.5%.
Householder Income Under 25 years Correlation Summary
| Measurement | Tlingit-Haida | Bangladeshi |
| Minimum | $33,750 | $29,883 |
| Maximum | $75,104 | $90,583 |
| Range | $41,354 | $60,700 |
| Mean | $56,260 | $49,001 |
| Median | $56,462 | $48,654 |
| Interquartile 25% (IQ1) | $45,554 | $39,531 |
| Interquartile 75% (IQ3) | $69,196 | $54,671 |
| Interquartile Range (IQR) | $23,642 | $15,140 |
| Standard Deviation (Sample) | $13,469 | $12,360 |
| Standard Deviation (Population) | $13,067 | $12,222 |
Similar Demographics by Householder Income Under 25 years
Demographics Similar to Tlingit-Haida by Householder Income Under 25 years
In terms of householder income under 25 years, the demographic groups most similar to Tlingit-Haida are Immigrants from Israel ($55,913, a difference of 0.0%), Immigrants from Japan ($55,932, a difference of 0.030%), Inupiat ($55,935, a difference of 0.040%), Immigrants from Russia ($55,891, a difference of 0.040%), and Immigrants from Iran ($55,880, a difference of 0.060%).
| Demographics | Rating | Rank | Householder Income Under 25 years |
| Immigrants | Peru | 100.0 /100 | #28 | Exceptional $56,384 |
| Immigrants | Asia | 100.0 /100 | #29 | Exceptional $56,379 |
| Immigrants | Moldova | 100.0 /100 | #30 | Exceptional $56,168 |
| Vietnamese | 100.0 /100 | #31 | Exceptional $56,127 |
| Peruvians | 100.0 /100 | #32 | Exceptional $56,052 |
| Inupiat | 100.0 /100 | #33 | Exceptional $55,935 |
| Immigrants | Japan | 100.0 /100 | #34 | Exceptional $55,932 |
| Tlingit-Haida | 100.0 /100 | #35 | Exceptional $55,914 |
| Immigrants | Israel | 100.0 /100 | #36 | Exceptional $55,913 |
| Immigrants | Russia | 100.0 /100 | #37 | Exceptional $55,891 |
| Immigrants | Iran | 100.0 /100 | #38 | Exceptional $55,880 |
| Immigrants | Belarus | 100.0 /100 | #39 | Exceptional $55,743 |
| Immigrants | Greece | 100.0 /100 | #40 | Exceptional $55,727 |
| Immigrants | Guyana | 100.0 /100 | #41 | Exceptional $55,726 |
| Immigrants | Korea | 100.0 /100 | #42 | Exceptional $55,716 |
Demographics Similar to Bangladeshis by Householder Income Under 25 years
In terms of householder income under 25 years, the demographic groups most similar to Bangladeshis are Comanche ($47,518, a difference of 0.15%), Native/Alaskan ($47,704, a difference of 0.24%), U.S. Virgin Islander ($47,448, a difference of 0.30%), Iroquois ($47,380, a difference of 0.44%), and Ottawa ($47,366, a difference of 0.47%).
| Demographics | Rating | Rank | Householder Income Under 25 years |
| Immigrants | Somalia | 0.0 /100 | #300 | Tragic $48,135 |
| Immigrants | Kuwait | 0.0 /100 | #301 | Tragic $48,126 |
| Immigrants | Liberia | 0.0 /100 | #302 | Tragic $47,981 |
| Immigrants | Middle Africa | 0.0 /100 | #303 | Tragic $47,916 |
| Menominee | 0.0 /100 | #304 | Tragic $47,907 |
| Cherokee | 0.0 /100 | #305 | Tragic $47,848 |
| Natives/Alaskans | 0.0 /100 | #306 | Tragic $47,704 |
| Bangladeshis | 0.0 /100 | #307 | Tragic $47,589 |
| Comanche | 0.0 /100 | #308 | Tragic $47,518 |
| U.S. Virgin Islanders | 0.0 /100 | #309 | Tragic $47,448 |
| Iroquois | 0.0 /100 | #310 | Tragic $47,380 |
| Ottawa | 0.0 /100 | #311 | Tragic $47,366 |
| Bermudans | 0.0 /100 | #312 | Tragic $47,359 |
| Delaware | 0.0 /100 | #313 | Tragic $47,159 |
| Chippewa | 0.0 /100 | #314 | Tragic $47,015 |