Tlingit-Haida vs Mongolian Median Earnings
COMPARE
Tlingit-Haida
Mongolian
Median Earnings
Median Earnings Comparison
Tlingit-Haida
Mongolians
$45,468
MEDIAN EARNINGS
20.5/ 100
METRIC RATING
217th/ 347
METRIC RANK
$51,038
MEDIAN EARNINGS
99.8/ 100
METRIC RATING
69th/ 347
METRIC RANK
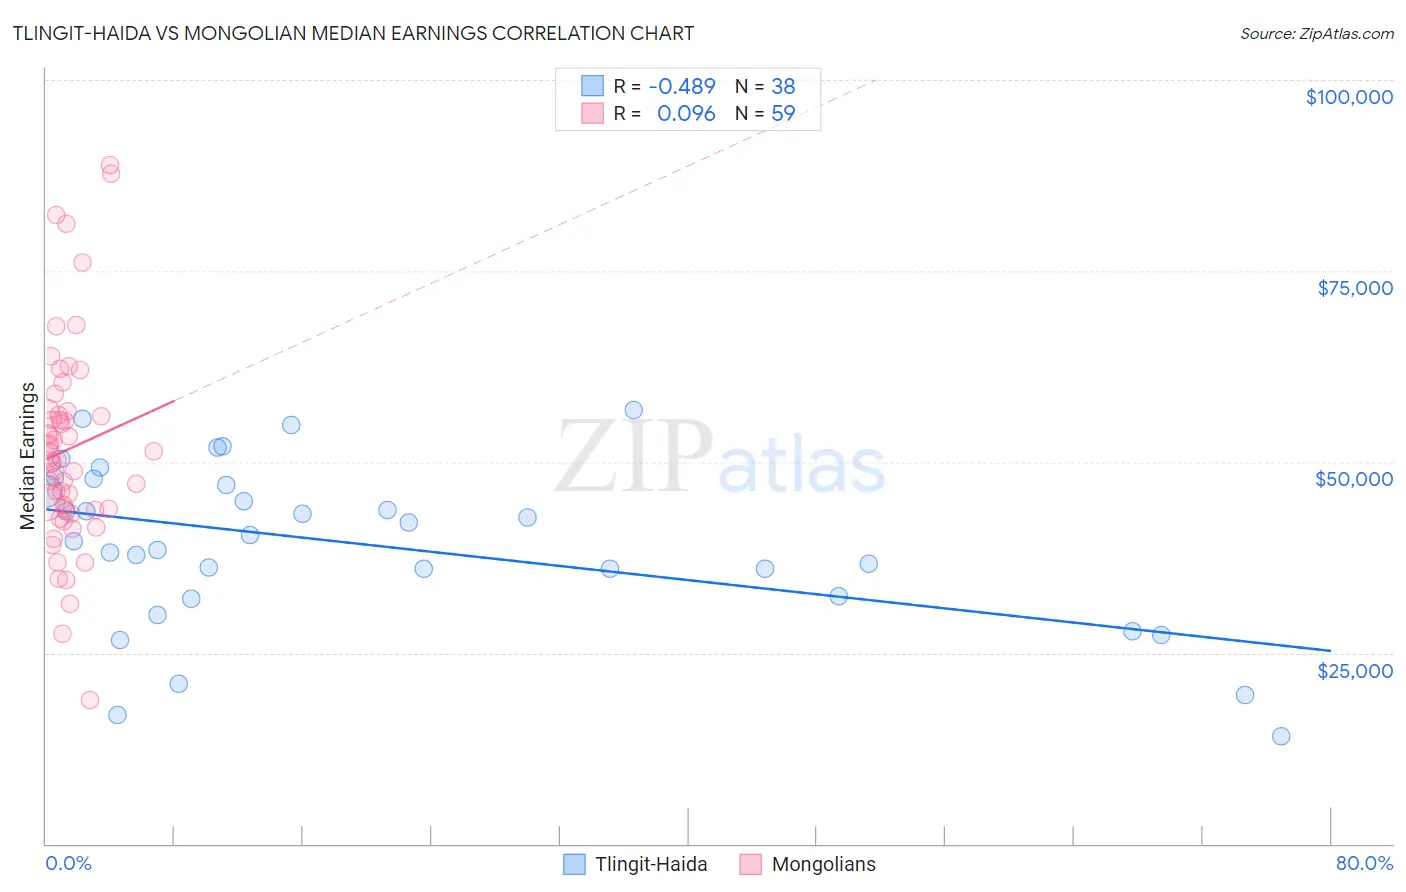
Tlingit-Haida vs Mongolian Median Earnings Correlation Chart
The statistical analysis conducted on geographies consisting of 60,865,073 people shows a moderate negative correlation between the proportion of Tlingit-Haida and median earnings in the United States with a correlation coefficient (R) of -0.489 and weighted average of $45,468. Similarly, the statistical analysis conducted on geographies consisting of 140,341,954 people shows a slight positive correlation between the proportion of Mongolians and median earnings in the United States with a correlation coefficient (R) of 0.096 and weighted average of $51,038, a difference of 12.2%.
Median Earnings Correlation Summary
| Measurement | Tlingit-Haida | Mongolian |
| Minimum | $14,091 | $18,750 |
| Maximum | $56,765 | $88,819 |
| Range | $42,674 | $70,069 |
| Mean | $39,098 | $51,652 |
| Median | $40,018 | $50,317 |
| Interquartile 25% (IQ1) | $32,344 | $43,750 |
| Interquartile 75% (IQ3) | $46,917 | $56,610 |
| Interquartile Range (IQR) | $14,573 | $12,860 |
| Standard Deviation (Sample) | $10,751 | $13,573 |
| Standard Deviation (Population) | $10,609 | $13,457 |
Similar Demographics by Median Earnings
Demographics Similar to Tlingit-Haida by Median Earnings
In terms of median earnings, the demographic groups most similar to Tlingit-Haida are Guyanese ($45,470, a difference of 0.0%), Spanish ($45,432, a difference of 0.080%), Nigerian ($45,532, a difference of 0.14%), Immigrants from Bangladesh ($45,532, a difference of 0.14%), and Immigrants from Colombia ($45,550, a difference of 0.18%).
| Demographics | Rating | Rank | Median Earnings |
| Immigrants | Grenada | 23.6 /100 | #210 | Fair $45,596 |
| Panamanians | 23.5 /100 | #211 | Fair $45,593 |
| Bermudans | 23.5 /100 | #212 | Fair $45,593 |
| Immigrants | Colombia | 22.4 /100 | #213 | Fair $45,550 |
| Nigerians | 22.0 /100 | #214 | Fair $45,532 |
| Immigrants | Bangladesh | 22.0 /100 | #215 | Fair $45,532 |
| Guyanese | 20.6 /100 | #216 | Fair $45,470 |
| Tlingit-Haida | 20.5 /100 | #217 | Fair $45,468 |
| Spanish | 19.7 /100 | #218 | Poor $45,432 |
| Dutch | 18.4 /100 | #219 | Poor $45,370 |
| Ecuadorians | 15.3 /100 | #220 | Poor $45,214 |
| Immigrants | Guyana | 15.1 /100 | #221 | Poor $45,204 |
| Immigrants | Panama | 15.0 /100 | #222 | Poor $45,198 |
| Whites/Caucasians | 15.0 /100 | #223 | Poor $45,197 |
| West Indians | 13.9 /100 | #224 | Poor $45,132 |
Demographics Similar to Mongolians by Median Earnings
In terms of median earnings, the demographic groups most similar to Mongolians are Paraguayan ($51,068, a difference of 0.060%), Lithuanian ($50,991, a difference of 0.090%), Immigrants from Ukraine ($50,984, a difference of 0.10%), Immigrants from Spain ($51,092, a difference of 0.11%), and Afghan ($51,112, a difference of 0.15%).
| Demographics | Rating | Rank | Median Earnings |
| Immigrants | Romania | 99.9 /100 | #62 | Exceptional $51,337 |
| Immigrants | Bulgaria | 99.9 /100 | #63 | Exceptional $51,318 |
| New Zealanders | 99.9 /100 | #64 | Exceptional $51,246 |
| Greeks | 99.9 /100 | #65 | Exceptional $51,164 |
| Afghans | 99.9 /100 | #66 | Exceptional $51,112 |
| Immigrants | Spain | 99.9 /100 | #67 | Exceptional $51,092 |
| Paraguayans | 99.9 /100 | #68 | Exceptional $51,068 |
| Mongolians | 99.8 /100 | #69 | Exceptional $51,038 |
| Lithuanians | 99.8 /100 | #70 | Exceptional $50,991 |
| Immigrants | Ukraine | 99.8 /100 | #71 | Exceptional $50,984 |
| Immigrants | Egypt | 99.8 /100 | #72 | Exceptional $50,901 |
| Immigrants | Netherlands | 99.8 /100 | #73 | Exceptional $50,818 |
| South Africans | 99.8 /100 | #74 | Exceptional $50,752 |
| Immigrants | Scotland | 99.8 /100 | #75 | Exceptional $50,741 |
| Immigrants | Italy | 99.7 /100 | #76 | Exceptional $50,581 |