Tlingit-Haida vs Hungarian Householder Income Under 25 years
COMPARE
Tlingit-Haida
Hungarian
Householder Income Under 25 years
Householder Income Under 25 years Comparison
Tlingit-Haida
Hungarians
$55,914
HOUSEHOLDER INCOME UNDER 25 YEARS
100.0/ 100
METRIC RATING
35th/ 347
METRIC RANK
$50,247
HOUSEHOLDER INCOME UNDER 25 YEARS
0.9/ 100
METRIC RATING
261st/ 347
METRIC RANK
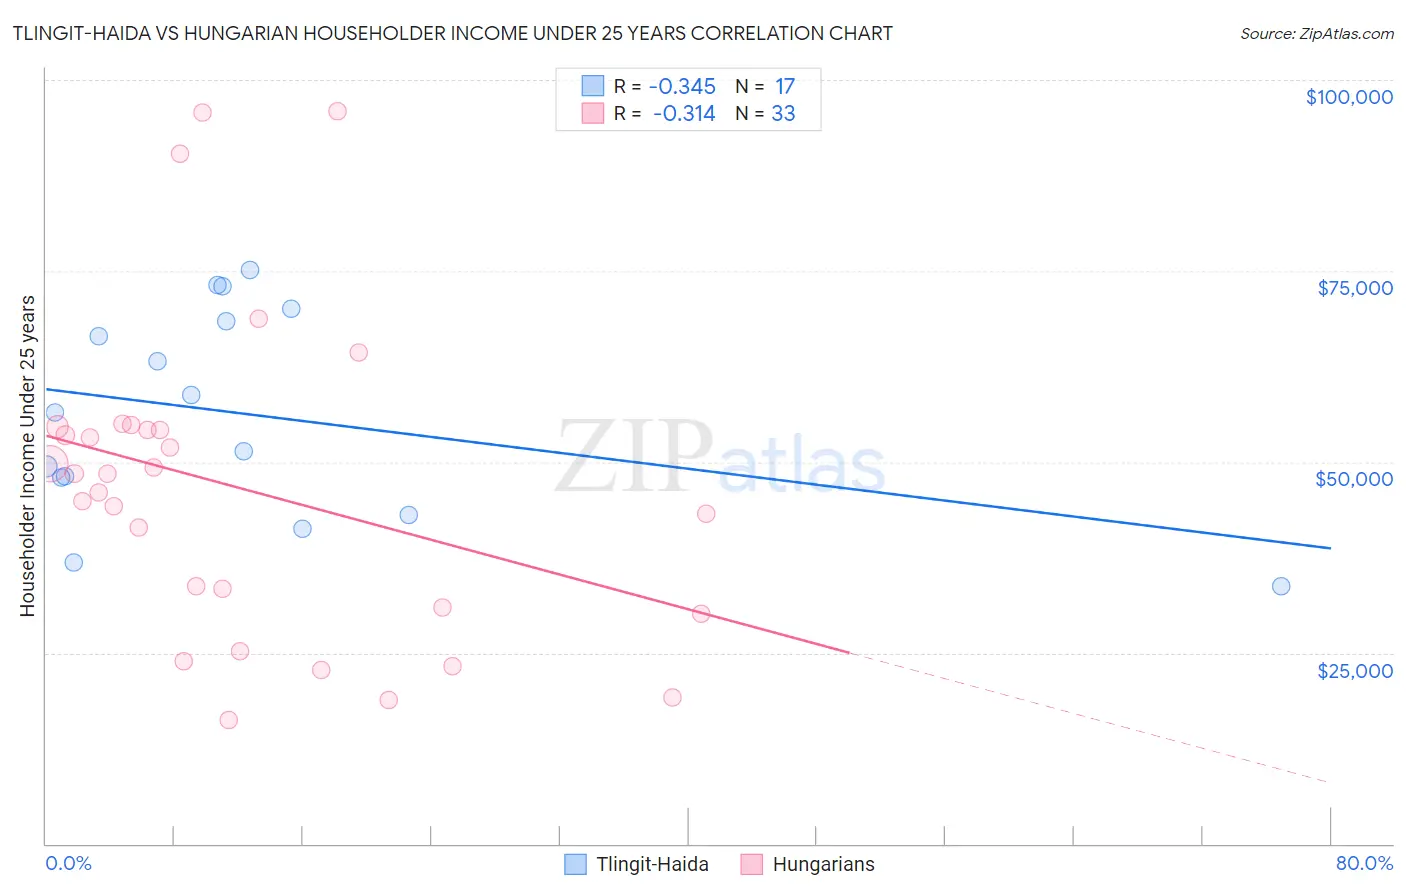
Tlingit-Haida vs Hungarian Householder Income Under 25 years Correlation Chart
The statistical analysis conducted on geographies consisting of 57,369,671 people shows a mild negative correlation between the proportion of Tlingit-Haida and household income with householder under the age of 25 in the United States with a correlation coefficient (R) of -0.345 and weighted average of $55,914. Similarly, the statistical analysis conducted on geographies consisting of 392,087,148 people shows a mild negative correlation between the proportion of Hungarians and household income with householder under the age of 25 in the United States with a correlation coefficient (R) of -0.314 and weighted average of $50,247, a difference of 11.3%.
Householder Income Under 25 years Correlation Summary
| Measurement | Tlingit-Haida | Hungarian |
| Minimum | $33,750 | $16,220 |
| Maximum | $75,104 | $95,845 |
| Range | $41,354 | $79,625 |
| Mean | $56,260 | $46,639 |
| Median | $56,462 | $48,413 |
| Interquartile 25% (IQ1) | $45,554 | $30,495 |
| Interquartile 75% (IQ3) | $69,196 | $54,364 |
| Interquartile Range (IQR) | $23,642 | $23,869 |
| Standard Deviation (Sample) | $13,469 | $20,516 |
| Standard Deviation (Population) | $13,067 | $20,203 |
Similar Demographics by Householder Income Under 25 years
Demographics Similar to Tlingit-Haida by Householder Income Under 25 years
In terms of householder income under 25 years, the demographic groups most similar to Tlingit-Haida are Immigrants from Israel ($55,913, a difference of 0.0%), Immigrants from Japan ($55,932, a difference of 0.030%), Inupiat ($55,935, a difference of 0.040%), Immigrants from Russia ($55,891, a difference of 0.040%), and Immigrants from Iran ($55,880, a difference of 0.060%).
| Demographics | Rating | Rank | Householder Income Under 25 years |
| Immigrants | Peru | 100.0 /100 | #28 | Exceptional $56,384 |
| Immigrants | Asia | 100.0 /100 | #29 | Exceptional $56,379 |
| Immigrants | Moldova | 100.0 /100 | #30 | Exceptional $56,168 |
| Vietnamese | 100.0 /100 | #31 | Exceptional $56,127 |
| Peruvians | 100.0 /100 | #32 | Exceptional $56,052 |
| Inupiat | 100.0 /100 | #33 | Exceptional $55,935 |
| Immigrants | Japan | 100.0 /100 | #34 | Exceptional $55,932 |
| Tlingit-Haida | 100.0 /100 | #35 | Exceptional $55,914 |
| Immigrants | Israel | 100.0 /100 | #36 | Exceptional $55,913 |
| Immigrants | Russia | 100.0 /100 | #37 | Exceptional $55,891 |
| Immigrants | Iran | 100.0 /100 | #38 | Exceptional $55,880 |
| Immigrants | Belarus | 100.0 /100 | #39 | Exceptional $55,743 |
| Immigrants | Greece | 100.0 /100 | #40 | Exceptional $55,727 |
| Immigrants | Guyana | 100.0 /100 | #41 | Exceptional $55,726 |
| Immigrants | Korea | 100.0 /100 | #42 | Exceptional $55,716 |
Demographics Similar to Hungarians by Householder Income Under 25 years
In terms of householder income under 25 years, the demographic groups most similar to Hungarians are Haitian ($50,231, a difference of 0.030%), Hispanic or Latino ($50,279, a difference of 0.060%), Immigrants from Dominican Republic ($50,204, a difference of 0.090%), Immigrants from Dominica ($50,301, a difference of 0.11%), and White/Caucasian ($50,336, a difference of 0.18%).
| Demographics | Rating | Rank | Householder Income Under 25 years |
| Luxembourgers | 1.2 /100 | #254 | Tragic $50,379 |
| Aleuts | 1.2 /100 | #255 | Tragic $50,377 |
| Immigrants | Cuba | 1.2 /100 | #256 | Tragic $50,374 |
| Lebanese | 1.1 /100 | #257 | Tragic $50,355 |
| Whites/Caucasians | 1.1 /100 | #258 | Tragic $50,336 |
| Immigrants | Dominica | 1.0 /100 | #259 | Tragic $50,301 |
| Hispanics or Latinos | 0.9 /100 | #260 | Tragic $50,279 |
| Hungarians | 0.9 /100 | #261 | Tragic $50,247 |
| Haitians | 0.8 /100 | #262 | Tragic $50,231 |
| Immigrants | Dominican Republic | 0.8 /100 | #263 | Tragic $50,204 |
| Fijians | 0.6 /100 | #264 | Tragic $50,132 |
| Belgians | 0.6 /100 | #265 | Tragic $50,113 |
| Immigrants | Venezuela | 0.6 /100 | #266 | Tragic $50,109 |
| Immigrants | Laos | 0.5 /100 | #267 | Tragic $50,041 |
| Venezuelans | 0.5 /100 | #268 | Tragic $50,011 |