Subsaharan African vs Mongolian Householder Income Under 25 years
COMPARE
Subsaharan African
Mongolian
Householder Income Under 25 years
Householder Income Under 25 years Comparison
Sub-Saharan Africans
Mongolians
$48,691
HOUSEHOLDER INCOME UNDER 25 YEARS
0.0/ 100
METRIC RATING
293rd/ 347
METRIC RANK
$52,540
HOUSEHOLDER INCOME UNDER 25 YEARS
70.2/ 100
METRIC RATING
159th/ 347
METRIC RANK
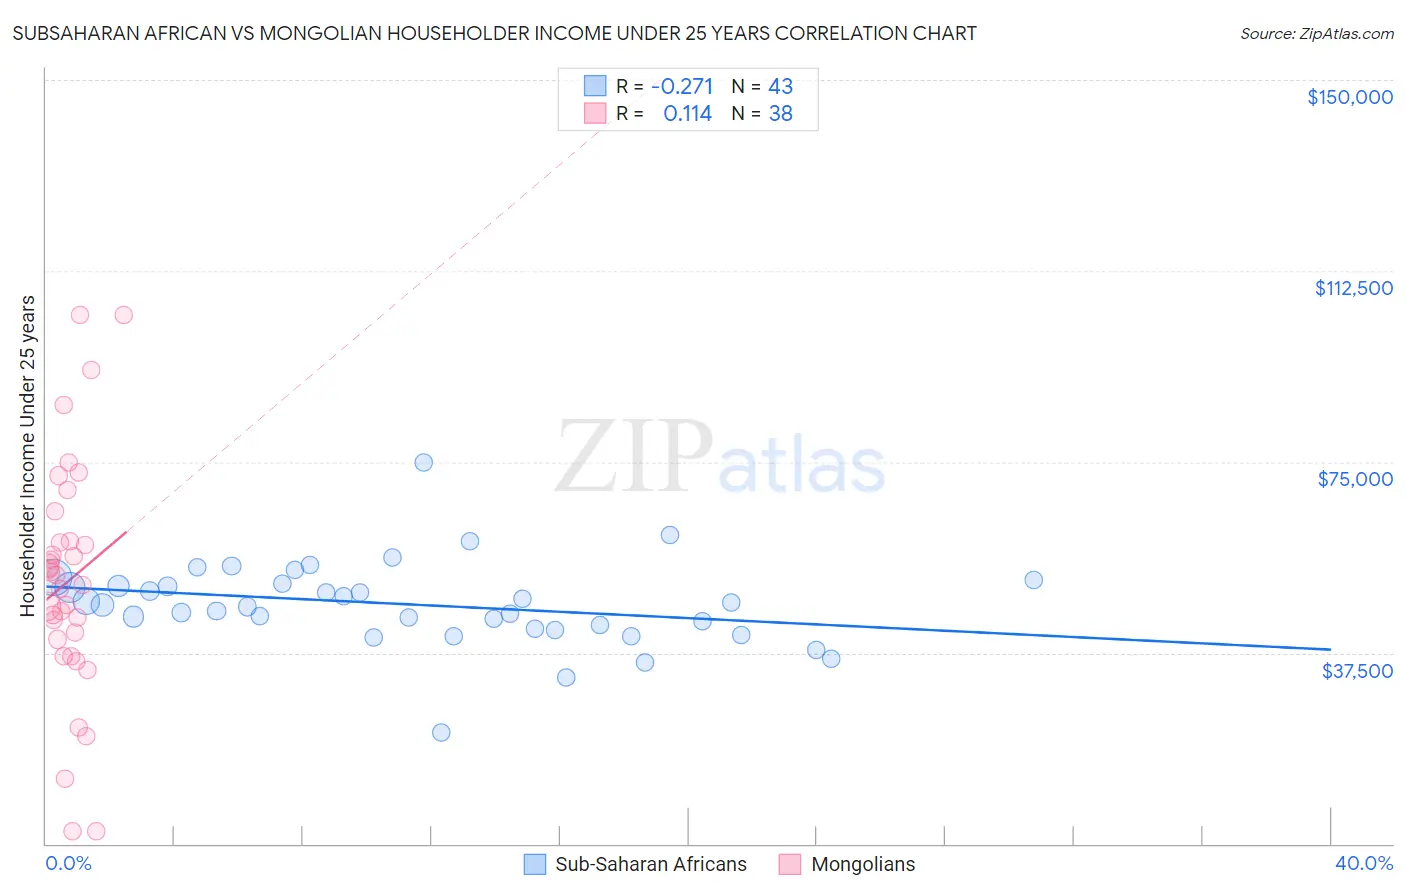
Subsaharan African vs Mongolian Householder Income Under 25 years Correlation Chart
The statistical analysis conducted on geographies consisting of 413,616,575 people shows a weak negative correlation between the proportion of Sub-Saharan Africans and household income with householder under the age of 25 in the United States with a correlation coefficient (R) of -0.271 and weighted average of $48,691. Similarly, the statistical analysis conducted on geographies consisting of 130,351,633 people shows a poor positive correlation between the proportion of Mongolians and household income with householder under the age of 25 in the United States with a correlation coefficient (R) of 0.114 and weighted average of $52,540, a difference of 7.9%.
Householder Income Under 25 years Correlation Summary
| Measurement | Subsaharan African | Mongolian |
| Minimum | $21,932 | $2,499 |
| Maximum | $74,779 | $103,839 |
| Range | $52,847 | $101,340 |
| Mean | $46,996 | $51,654 |
| Median | $46,794 | $51,754 |
| Interquartile 25% (IQ1) | $42,165 | $40,145 |
| Interquartile 75% (IQ3) | $51,035 | $59,299 |
| Interquartile Range (IQR) | $8,871 | $19,154 |
| Standard Deviation (Sample) | $8,415 | $23,318 |
| Standard Deviation (Population) | $8,316 | $23,009 |
Similar Demographics by Householder Income Under 25 years
Demographics Similar to Sub-Saharan Africans by Householder Income Under 25 years
In terms of householder income under 25 years, the demographic groups most similar to Sub-Saharan Africans are Shoshone ($48,720, a difference of 0.060%), Somali ($48,657, a difference of 0.070%), Central American Indian ($48,643, a difference of 0.10%), Immigrants from Burma/Myanmar ($48,749, a difference of 0.12%), and Blackfeet ($48,603, a difference of 0.18%).
| Demographics | Rating | Rank | Householder Income Under 25 years |
| French American Indians | 0.0 /100 | #286 | Tragic $48,977 |
| Senegalese | 0.0 /100 | #287 | Tragic $48,953 |
| Liberians | 0.0 /100 | #288 | Tragic $48,917 |
| Hondurans | 0.0 /100 | #289 | Tragic $48,885 |
| Americans | 0.0 /100 | #290 | Tragic $48,860 |
| Immigrants | Burma/Myanmar | 0.0 /100 | #291 | Tragic $48,749 |
| Shoshone | 0.0 /100 | #292 | Tragic $48,720 |
| Sub-Saharan Africans | 0.0 /100 | #293 | Tragic $48,691 |
| Somalis | 0.0 /100 | #294 | Tragic $48,657 |
| Central American Indians | 0.0 /100 | #295 | Tragic $48,643 |
| Blackfeet | 0.0 /100 | #296 | Tragic $48,603 |
| Cree | 0.0 /100 | #297 | Tragic $48,514 |
| Yaqui | 0.0 /100 | #298 | Tragic $48,300 |
| Immigrants | Honduras | 0.0 /100 | #299 | Tragic $48,267 |
| Immigrants | Somalia | 0.0 /100 | #300 | Tragic $48,135 |
Demographics Similar to Mongolians by Householder Income Under 25 years
In terms of householder income under 25 years, the demographic groups most similar to Mongolians are Immigrants from Turkey ($52,503, a difference of 0.070%), Ghanaian ($52,594, a difference of 0.10%), Immigrants from Netherlands ($52,592, a difference of 0.10%), Immigrants from Nepal ($52,611, a difference of 0.13%), and Immigrants from Denmark ($52,612, a difference of 0.14%).
| Demographics | Rating | Rank | Householder Income Under 25 years |
| Trinidadians and Tobagonians | 74.6 /100 | #152 | Good $52,631 |
| Central Americans | 74.4 /100 | #153 | Good $52,626 |
| Immigrants | Azores | 74.2 /100 | #154 | Good $52,621 |
| Immigrants | Denmark | 73.8 /100 | #155 | Good $52,612 |
| Immigrants | Nepal | 73.7 /100 | #156 | Good $52,611 |
| Ghanaians | 72.9 /100 | #157 | Good $52,594 |
| Immigrants | Netherlands | 72.8 /100 | #158 | Good $52,592 |
| Mongolians | 70.2 /100 | #159 | Good $52,540 |
| Immigrants | Turkey | 68.3 /100 | #160 | Good $52,503 |
| Uruguayans | 66.2 /100 | #161 | Good $52,465 |
| Immigrants | Cambodia | 65.4 /100 | #162 | Good $52,450 |
| Immigrants | Chile | 64.8 /100 | #163 | Good $52,440 |
| Immigrants | Trinidad and Tobago | 64.7 /100 | #164 | Good $52,437 |
| Poles | 63.0 /100 | #165 | Good $52,407 |
| Immigrants | Austria | 62.6 /100 | #166 | Good $52,400 |