Tlingit-Haida vs Turkish Householder Income Under 25 years
COMPARE
Tlingit-Haida
Turkish
Householder Income Under 25 years
Householder Income Under 25 years Comparison
Tlingit-Haida
Turks
$55,914
HOUSEHOLDER INCOME UNDER 25 YEARS
100.0/ 100
METRIC RATING
35th/ 347
METRIC RANK
$54,266
HOUSEHOLDER INCOME UNDER 25 YEARS
99.4/ 100
METRIC RATING
90th/ 347
METRIC RANK
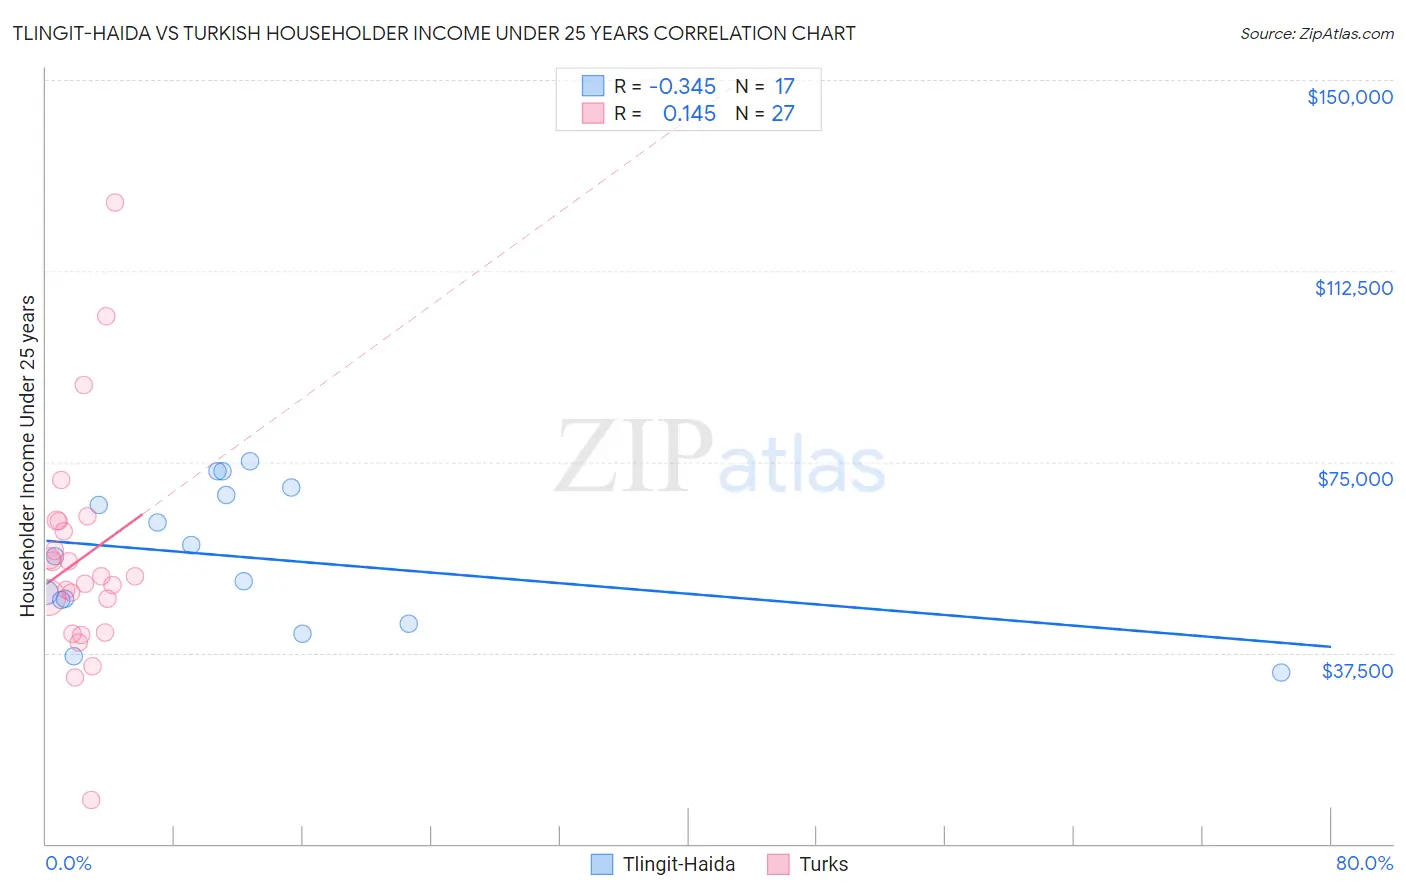
Tlingit-Haida vs Turkish Householder Income Under 25 years Correlation Chart
The statistical analysis conducted on geographies consisting of 57,369,671 people shows a mild negative correlation between the proportion of Tlingit-Haida and household income with householder under the age of 25 in the United States with a correlation coefficient (R) of -0.345 and weighted average of $55,914. Similarly, the statistical analysis conducted on geographies consisting of 234,402,010 people shows a poor positive correlation between the proportion of Turks and household income with householder under the age of 25 in the United States with a correlation coefficient (R) of 0.145 and weighted average of $54,266, a difference of 3.0%.
Householder Income Under 25 years Correlation Summary
| Measurement | Tlingit-Haida | Turkish |
| Minimum | $33,750 | $8,508 |
| Maximum | $75,104 | $125,890 |
| Range | $41,354 | $117,382 |
| Mean | $56,260 | $55,917 |
| Median | $56,462 | $52,500 |
| Interquartile 25% (IQ1) | $45,554 | $41,438 |
| Interquartile 75% (IQ3) | $69,196 | $63,275 |
| Interquartile Range (IQR) | $23,642 | $21,837 |
| Standard Deviation (Sample) | $13,469 | $22,543 |
| Standard Deviation (Population) | $13,067 | $22,121 |
Similar Demographics by Householder Income Under 25 years
Demographics Similar to Tlingit-Haida by Householder Income Under 25 years
In terms of householder income under 25 years, the demographic groups most similar to Tlingit-Haida are Immigrants from Israel ($55,913, a difference of 0.0%), Immigrants from Japan ($55,932, a difference of 0.030%), Inupiat ($55,935, a difference of 0.040%), Immigrants from Russia ($55,891, a difference of 0.040%), and Immigrants from Iran ($55,880, a difference of 0.060%).
| Demographics | Rating | Rank | Householder Income Under 25 years |
| Immigrants | Peru | 100.0 /100 | #28 | Exceptional $56,384 |
| Immigrants | Asia | 100.0 /100 | #29 | Exceptional $56,379 |
| Immigrants | Moldova | 100.0 /100 | #30 | Exceptional $56,168 |
| Vietnamese | 100.0 /100 | #31 | Exceptional $56,127 |
| Peruvians | 100.0 /100 | #32 | Exceptional $56,052 |
| Inupiat | 100.0 /100 | #33 | Exceptional $55,935 |
| Immigrants | Japan | 100.0 /100 | #34 | Exceptional $55,932 |
| Tlingit-Haida | 100.0 /100 | #35 | Exceptional $55,914 |
| Immigrants | Israel | 100.0 /100 | #36 | Exceptional $55,913 |
| Immigrants | Russia | 100.0 /100 | #37 | Exceptional $55,891 |
| Immigrants | Iran | 100.0 /100 | #38 | Exceptional $55,880 |
| Immigrants | Belarus | 100.0 /100 | #39 | Exceptional $55,743 |
| Immigrants | Greece | 100.0 /100 | #40 | Exceptional $55,727 |
| Immigrants | Guyana | 100.0 /100 | #41 | Exceptional $55,726 |
| Immigrants | Korea | 100.0 /100 | #42 | Exceptional $55,716 |
Demographics Similar to Turks by Householder Income Under 25 years
In terms of householder income under 25 years, the demographic groups most similar to Turks are Immigrants from South America ($54,268, a difference of 0.0%), Immigrants from Egypt ($54,239, a difference of 0.050%), Immigrants from St. Vincent and the Grenadines ($54,230, a difference of 0.070%), Yakama ($54,321, a difference of 0.10%), and Immigrants from Argentina ($54,209, a difference of 0.10%).
| Demographics | Rating | Rank | Householder Income Under 25 years |
| Laotians | 99.5 /100 | #83 | Exceptional $54,369 |
| Bulgarians | 99.5 /100 | #84 | Exceptional $54,352 |
| Immigrants | Czechoslovakia | 99.5 /100 | #85 | Exceptional $54,352 |
| Immigrants | Croatia | 99.5 /100 | #86 | Exceptional $54,343 |
| Brazilians | 99.5 /100 | #87 | Exceptional $54,335 |
| Yakama | 99.5 /100 | #88 | Exceptional $54,321 |
| Immigrants | South America | 99.4 /100 | #89 | Exceptional $54,268 |
| Turks | 99.4 /100 | #90 | Exceptional $54,266 |
| Immigrants | Egypt | 99.3 /100 | #91 | Exceptional $54,239 |
| Immigrants | St. Vincent and the Grenadines | 99.3 /100 | #92 | Exceptional $54,230 |
| Immigrants | Argentina | 99.3 /100 | #93 | Exceptional $54,209 |
| Immigrants | Sierra Leone | 99.3 /100 | #94 | Exceptional $54,190 |
| Immigrants | Malaysia | 99.2 /100 | #95 | Exceptional $54,179 |
| Argentineans | 99.2 /100 | #96 | Exceptional $54,154 |
| Immigrants | Portugal | 99.1 /100 | #97 | Exceptional $54,105 |