Tlingit-Haida vs Marshallese Receiving Food Stamps
COMPARE
Tlingit-Haida
Marshallese
Receiving Food Stamps
Receiving Food Stamps Comparison
Tlingit-Haida
Marshallese
11.6%
RECEIVING FOOD STAMPS
59.1/ 100
METRIC RATING
168th/ 347
METRIC RANK
14.1%
RECEIVING FOOD STAMPS
0.3/ 100
METRIC RATING
254th/ 347
METRIC RANK
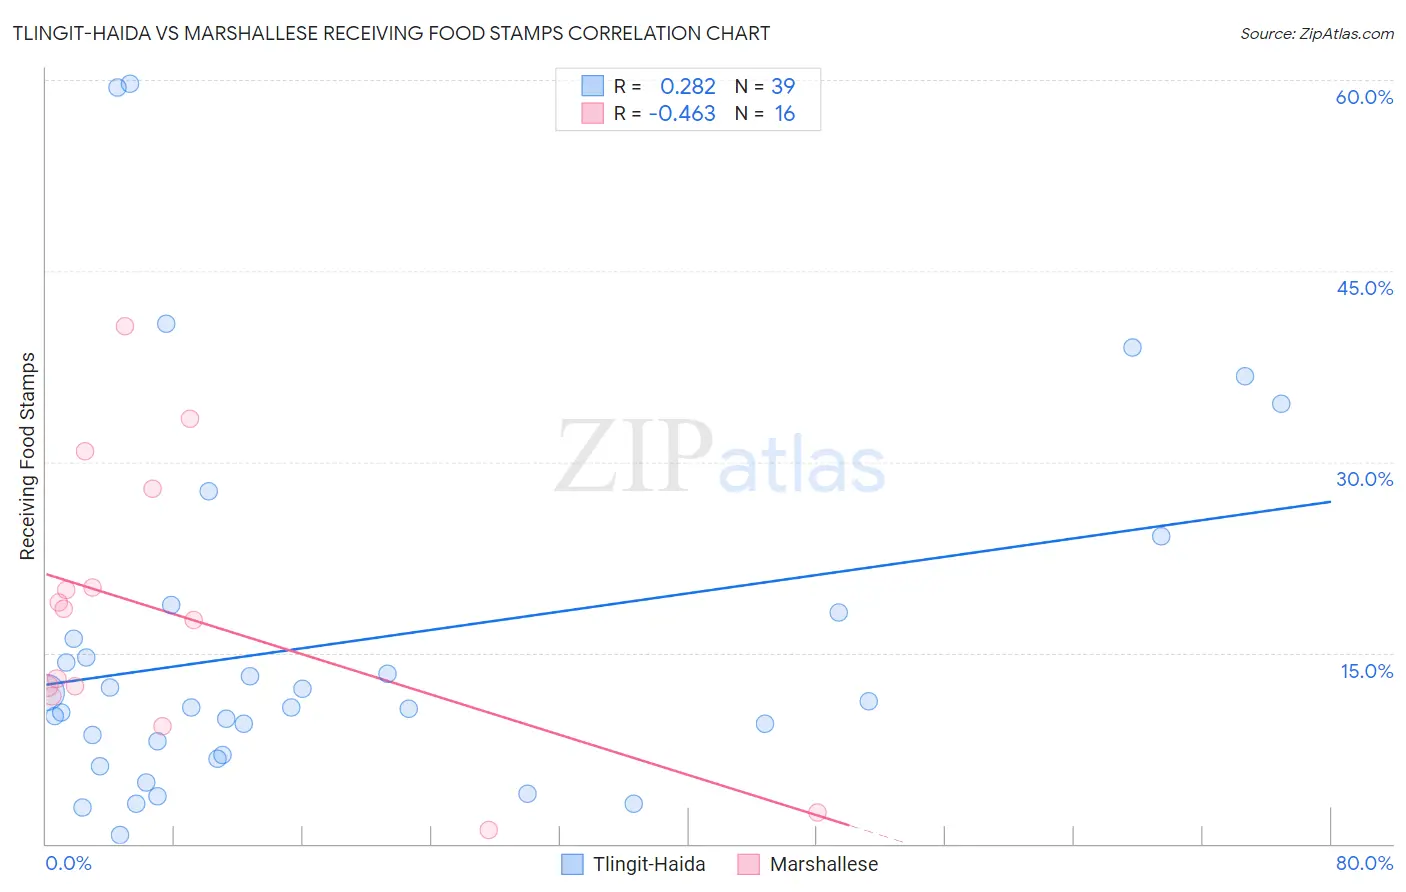
Tlingit-Haida vs Marshallese Receiving Food Stamps Correlation Chart
The statistical analysis conducted on geographies consisting of 60,831,023 people shows a weak positive correlation between the proportion of Tlingit-Haida and percentage of population receiving government assistance and/or food stamps in the United States with a correlation coefficient (R) of 0.282 and weighted average of 11.6%. Similarly, the statistical analysis conducted on geographies consisting of 14,761,315 people shows a moderate negative correlation between the proportion of Marshallese and percentage of population receiving government assistance and/or food stamps in the United States with a correlation coefficient (R) of -0.463 and weighted average of 14.1%, a difference of 21.6%.
Receiving Food Stamps Correlation Summary
| Measurement | Tlingit-Haida | Marshallese |
| Minimum | 0.70% | 1.1% |
| Maximum | 59.7% | 40.7% |
| Range | 59.0% | 39.6% |
| Mean | 15.8% | 18.1% |
| Median | 10.7% | 18.0% |
| Interquartile 25% (IQ1) | 7.0% | 12.0% |
| Interquartile 75% (IQ3) | 18.2% | 24.0% |
| Interquartile Range (IQR) | 11.2% | 12.0% |
| Standard Deviation (Sample) | 14.4% | 10.8% |
| Standard Deviation (Population) | 14.2% | 10.5% |
Similar Demographics by Receiving Food Stamps
Demographics Similar to Tlingit-Haida by Receiving Food Stamps
In terms of receiving food stamps, the demographic groups most similar to Tlingit-Haida are Immigrants from Eastern Africa (11.6%, a difference of 0.12%), Kenyan (11.6%, a difference of 0.16%), Costa Rican (11.6%, a difference of 0.18%), Immigrants from Western Asia (11.6%, a difference of 0.40%), and Immigrants from Belarus (11.5%, a difference of 0.54%).
| Demographics | Rating | Rank | Receiving Food Stamps |
| Pennsylvania Germans | 68.4 /100 | #161 | Good 11.4% |
| Alsatians | 68.0 /100 | #162 | Good 11.4% |
| Immigrants | Southern Europe | 65.8 /100 | #163 | Good 11.5% |
| Immigrants | Chile | 65.0 /100 | #164 | Good 11.5% |
| Arabs | 64.7 /100 | #165 | Good 11.5% |
| Immigrants | Belarus | 62.8 /100 | #166 | Good 11.5% |
| Kenyans | 60.2 /100 | #167 | Good 11.6% |
| Tlingit-Haida | 59.1 /100 | #168 | Average 11.6% |
| Immigrants | Eastern Africa | 58.3 /100 | #169 | Average 11.6% |
| Costa Ricans | 57.9 /100 | #170 | Average 11.6% |
| Immigrants | Western Asia | 56.4 /100 | #171 | Average 11.6% |
| Guamanians/Chamorros | 54.2 /100 | #172 | Average 11.7% |
| Immigrants | Syria | 53.4 /100 | #173 | Average 11.7% |
| Immigrants | Eritrea | 50.0 /100 | #174 | Average 11.7% |
| Osage | 49.8 /100 | #175 | Average 11.7% |
Demographics Similar to Marshallese by Receiving Food Stamps
In terms of receiving food stamps, the demographic groups most similar to Marshallese are Subsaharan African (14.1%, a difference of 0.010%), Japanese (14.1%, a difference of 0.030%), Arapaho (14.1%, a difference of 0.14%), Immigrants from Ghana (14.1%, a difference of 0.21%), and Creek (14.1%, a difference of 0.34%).
| Demographics | Rating | Rank | Receiving Food Stamps |
| Mexican American Indians | 0.7 /100 | #247 | Tragic 13.8% |
| Immigrants | Laos | 0.7 /100 | #248 | Tragic 13.8% |
| Indonesians | 0.6 /100 | #249 | Tragic 13.9% |
| Immigrants | Cambodia | 0.5 /100 | #250 | Tragic 13.9% |
| Yaqui | 0.5 /100 | #251 | Tragic 13.9% |
| Ghanaians | 0.5 /100 | #252 | Tragic 14.0% |
| Spanish Americans | 0.4 /100 | #253 | Tragic 14.0% |
| Marshallese | 0.3 /100 | #254 | Tragic 14.1% |
| Sub-Saharan Africans | 0.3 /100 | #255 | Tragic 14.1% |
| Japanese | 0.3 /100 | #256 | Tragic 14.1% |
| Arapaho | 0.3 /100 | #257 | Tragic 14.1% |
| Immigrants | Ghana | 0.3 /100 | #258 | Tragic 14.1% |
| Creek | 0.3 /100 | #259 | Tragic 14.1% |
| Central Americans | 0.3 /100 | #260 | Tragic 14.1% |
| Immigrants | Congo | 0.3 /100 | #261 | Tragic 14.1% |