Tlingit-Haida vs Marshallese 12th Grade, No Diploma
COMPARE
Tlingit-Haida
Marshallese
12th Grade, No Diploma
12th Grade, No Diploma Comparison
Tlingit-Haida
Marshallese
93.0%
12TH GRADE, NO DIPLOMA
99.8/ 100
METRIC RATING
38th/ 347
METRIC RANK
90.7%
12TH GRADE, NO DIPLOMA
18.2/ 100
METRIC RATING
202nd/ 347
METRIC RANK
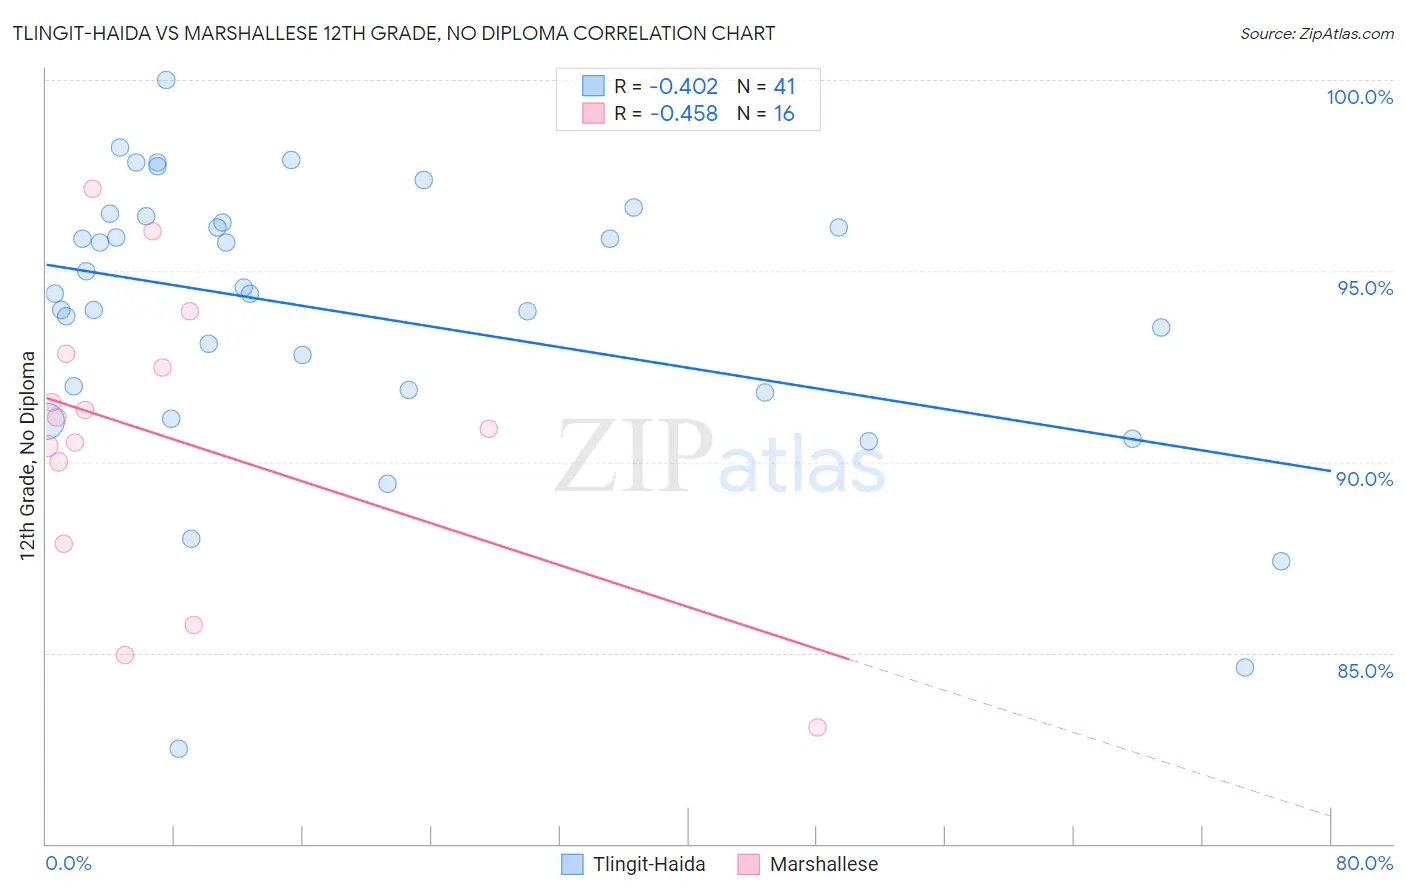
Tlingit-Haida vs Marshallese 12th Grade, No Diploma Correlation Chart
The statistical analysis conducted on geographies consisting of 60,871,919 people shows a moderate negative correlation between the proportion of Tlingit-Haida and percentage of population with at least 12th grade (no diploma) education in the United States with a correlation coefficient (R) of -0.402 and weighted average of 93.0%. Similarly, the statistical analysis conducted on geographies consisting of 14,761,315 people shows a moderate negative correlation between the proportion of Marshallese and percentage of population with at least 12th grade (no diploma) education in the United States with a correlation coefficient (R) of -0.458 and weighted average of 90.7%, a difference of 2.5%.
12th Grade, No Diploma Correlation Summary
| Measurement | Tlingit-Haida | Marshallese |
| Minimum | 82.5% | 83.0% |
| Maximum | 100.0% | 97.2% |
| Range | 17.5% | 14.1% |
| Mean | 93.9% | 90.6% |
| Median | 94.4% | 91.0% |
| Interquartile 25% (IQ1) | 91.8% | 88.9% |
| Interquartile 75% (IQ3) | 96.3% | 92.6% |
| Interquartile Range (IQR) | 4.5% | 3.7% |
| Standard Deviation (Sample) | 3.7% | 3.8% |
| Standard Deviation (Population) | 3.7% | 3.7% |
Similar Demographics by 12th Grade, No Diploma
Demographics Similar to Tlingit-Haida by 12th Grade, No Diploma
In terms of 12th grade, no diploma, the demographic groups most similar to Tlingit-Haida are Immigrants from Austria (93.0%, a difference of 0.010%), Turkish (93.0%, a difference of 0.010%), Bhutanese (93.0%, a difference of 0.010%), Scottish (93.0%, a difference of 0.030%), and Irish (93.0%, a difference of 0.030%).
| Demographics | Rating | Rank | 12th Grade, No Diploma |
| Immigrants | Ireland | 99.9 /100 | #31 | Exceptional 93.1% |
| Europeans | 99.9 /100 | #32 | Exceptional 93.1% |
| Immigrants | Scotland | 99.9 /100 | #33 | Exceptional 93.0% |
| Okinawans | 99.9 /100 | #34 | Exceptional 93.0% |
| English | 99.9 /100 | #35 | Exceptional 93.0% |
| Scottish | 99.9 /100 | #36 | Exceptional 93.0% |
| Irish | 99.9 /100 | #37 | Exceptional 93.0% |
| Tlingit-Haida | 99.8 /100 | #38 | Exceptional 93.0% |
| Immigrants | Austria | 99.8 /100 | #39 | Exceptional 93.0% |
| Turks | 99.8 /100 | #40 | Exceptional 93.0% |
| Bhutanese | 99.8 /100 | #41 | Exceptional 93.0% |
| Immigrants | Australia | 99.8 /100 | #42 | Exceptional 92.9% |
| Northern Europeans | 99.8 /100 | #43 | Exceptional 92.9% |
| Dutch | 99.8 /100 | #44 | Exceptional 92.9% |
| Greeks | 99.8 /100 | #45 | Exceptional 92.9% |
Demographics Similar to Marshallese by 12th Grade, No Diploma
In terms of 12th grade, no diploma, the demographic groups most similar to Marshallese are Immigrants from Southern Europe (90.8%, a difference of 0.030%), Liberian (90.8%, a difference of 0.030%), Hawaiian (90.8%, a difference of 0.030%), Samoan (90.8%, a difference of 0.040%), and Tongan (90.7%, a difference of 0.050%).
| Demographics | Rating | Rank | 12th Grade, No Diploma |
| Koreans | 24.5 /100 | #195 | Fair 90.8% |
| Panamanians | 22.8 /100 | #196 | Fair 90.8% |
| Immigrants | Sudan | 22.6 /100 | #197 | Fair 90.8% |
| Samoans | 20.4 /100 | #198 | Fair 90.8% |
| Immigrants | Southern Europe | 19.9 /100 | #199 | Poor 90.8% |
| Liberians | 19.8 /100 | #200 | Poor 90.8% |
| Hawaiians | 19.7 /100 | #201 | Poor 90.8% |
| Marshallese | 18.2 /100 | #202 | Poor 90.7% |
| Tongans | 16.1 /100 | #203 | Poor 90.7% |
| French American Indians | 15.5 /100 | #204 | Poor 90.7% |
| Immigrants | Sierra Leone | 14.9 /100 | #205 | Poor 90.7% |
| Immigrants | Bolivia | 12.3 /100 | #206 | Poor 90.6% |
| Armenians | 11.6 /100 | #207 | Poor 90.6% |
| Immigrants | Micronesia | 11.0 /100 | #208 | Poor 90.6% |
| Immigrants | Afghanistan | 11.0 /100 | #209 | Poor 90.6% |