Bulgarian vs Marshallese Householder Income Over 65 years
COMPARE
Bulgarian
Marshallese
Householder Income Over 65 years
Householder Income Over 65 years Comparison
Bulgarians
Marshallese
$66,236
HOUSEHOLDER INCOME OVER 65 YEARS
99.6/ 100
METRIC RATING
57th/ 347
METRIC RANK
$65,874
HOUSEHOLDER INCOME OVER 65 YEARS
99.4/ 100
METRIC RATING
63rd/ 347
METRIC RANK
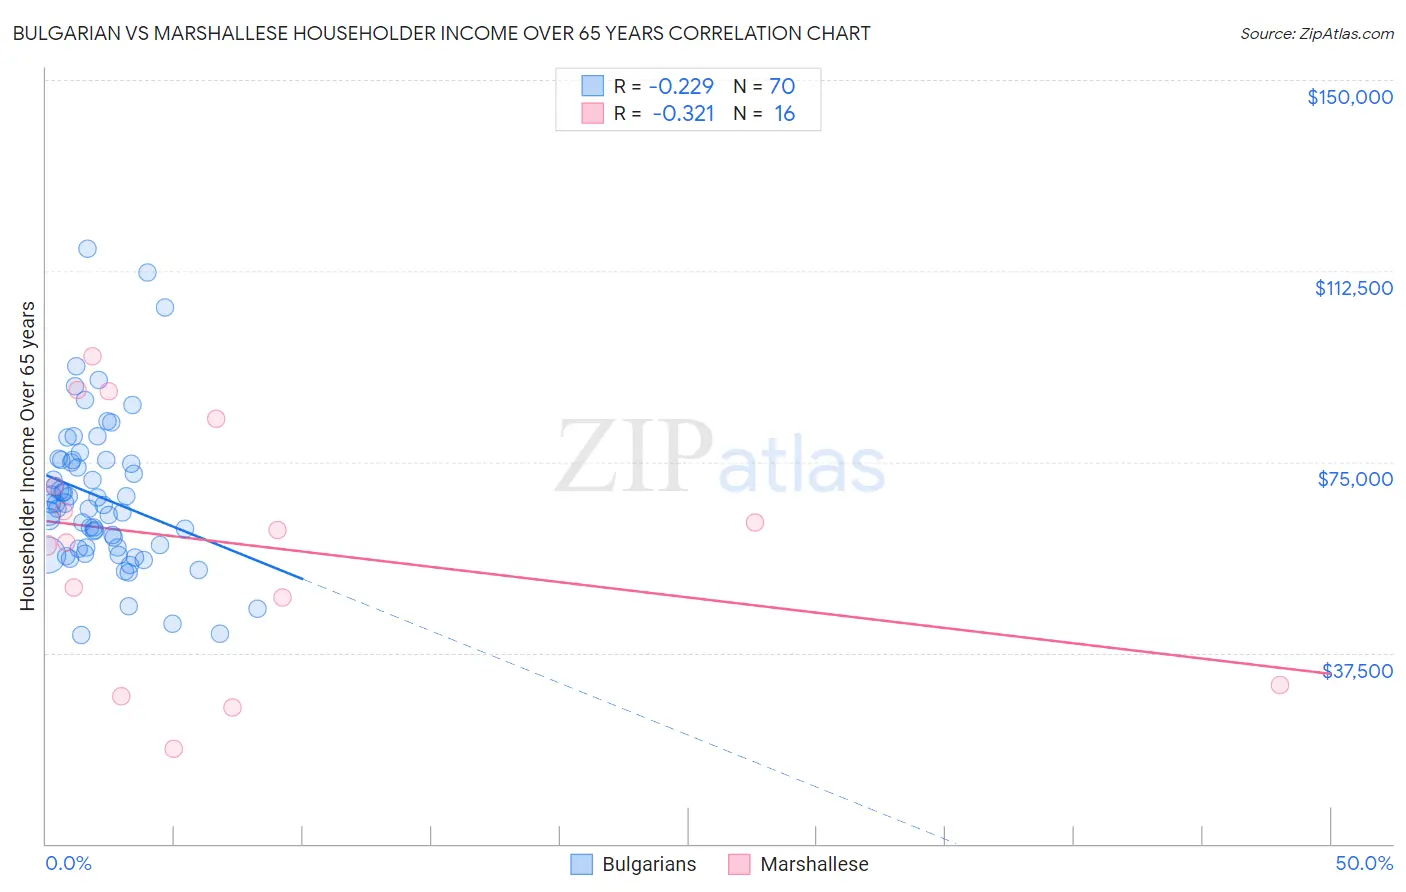
Bulgarian vs Marshallese Householder Income Over 65 years Correlation Chart
The statistical analysis conducted on geographies consisting of 205,399,104 people shows a weak negative correlation between the proportion of Bulgarians and household income with householder over the age of 65 in the United States with a correlation coefficient (R) of -0.229 and weighted average of $66,236. Similarly, the statistical analysis conducted on geographies consisting of 14,755,394 people shows a mild negative correlation between the proportion of Marshallese and household income with householder over the age of 65 in the United States with a correlation coefficient (R) of -0.321 and weighted average of $65,874, a difference of 0.55%.
Householder Income Over 65 years Correlation Summary
| Measurement | Bulgarian | Marshallese |
| Minimum | $40,918 | $18,720 |
| Maximum | $116,874 | $95,763 |
| Range | $75,956 | $77,043 |
| Mean | $68,096 | $58,723 |
| Median | $66,678 | $60,305 |
| Interquartile 25% (IQ1) | $58,125 | $39,754 |
| Interquartile 75% (IQ3) | $75,296 | $76,864 |
| Interquartile Range (IQR) | $17,171 | $37,109 |
| Standard Deviation (Sample) | $14,736 | $23,740 |
| Standard Deviation (Population) | $14,630 | $22,986 |
Demographics Similar to Bulgarians and Marshallese by Householder Income Over 65 years
In terms of householder income over 65 years, the demographic groups most similar to Bulgarians are Laotian ($66,306, a difference of 0.11%), Immigrants from Philippines ($66,161, a difference of 0.11%), Immigrants from Norway ($66,118, a difference of 0.18%), Immigrants from Czechoslovakia ($66,376, a difference of 0.21%), and Immigrants from Lithuania ($66,087, a difference of 0.22%). Similarly, the demographic groups most similar to Marshallese are Zimbabwean ($65,854, a difference of 0.030%), Immigrants from Sierra Leone ($66,009, a difference of 0.21%), Maltese ($66,027, a difference of 0.23%), Immigrants from England ($65,715, a difference of 0.24%), and Immigrants from Lithuania ($66,087, a difference of 0.32%).
| Demographics | Rating | Rank | Householder Income Over 65 years |
| Immigrants | Turkey | 99.7 /100 | #50 | Exceptional $66,672 |
| Israelis | 99.7 /100 | #51 | Exceptional $66,636 |
| Immigrants | Scotland | 99.7 /100 | #52 | Exceptional $66,620 |
| Immigrants | Pakistan | 99.7 /100 | #53 | Exceptional $66,617 |
| Immigrants | Netherlands | 99.7 /100 | #54 | Exceptional $66,463 |
| Immigrants | Czechoslovakia | 99.7 /100 | #55 | Exceptional $66,376 |
| Laotians | 99.6 /100 | #56 | Exceptional $66,306 |
| Bulgarians | 99.6 /100 | #57 | Exceptional $66,236 |
| Immigrants | Philippines | 99.6 /100 | #58 | Exceptional $66,161 |
| Immigrants | Norway | 99.5 /100 | #59 | Exceptional $66,118 |
| Immigrants | Lithuania | 99.5 /100 | #60 | Exceptional $66,087 |
| Maltese | 99.5 /100 | #61 | Exceptional $66,027 |
| Immigrants | Sierra Leone | 99.5 /100 | #62 | Exceptional $66,009 |
| Marshallese | 99.4 /100 | #63 | Exceptional $65,874 |
| Zimbabweans | 99.4 /100 | #64 | Exceptional $65,854 |
| Immigrants | England | 99.3 /100 | #65 | Exceptional $65,715 |
| South Africans | 99.3 /100 | #66 | Exceptional $65,652 |
| Immigrants | Malaysia | 99.1 /100 | #67 | Exceptional $65,497 |
| Egyptians | 99.1 /100 | #68 | Exceptional $65,441 |
| Samoans | 99.1 /100 | #69 | Exceptional $65,427 |
| Mongolians | 99.0 /100 | #70 | Exceptional $65,326 |