Tlingit-Haida vs Immigrants from Southern Europe Median Earnings
COMPARE
Tlingit-Haida
Immigrants from Southern Europe
Median Earnings
Median Earnings Comparison
Tlingit-Haida
Immigrants from Southern Europe
$45,468
MEDIAN EARNINGS
20.5/ 100
METRIC RATING
217th/ 347
METRIC RANK
$50,280
MEDIAN EARNINGS
99.6/ 100
METRIC RATING
81st/ 347
METRIC RANK
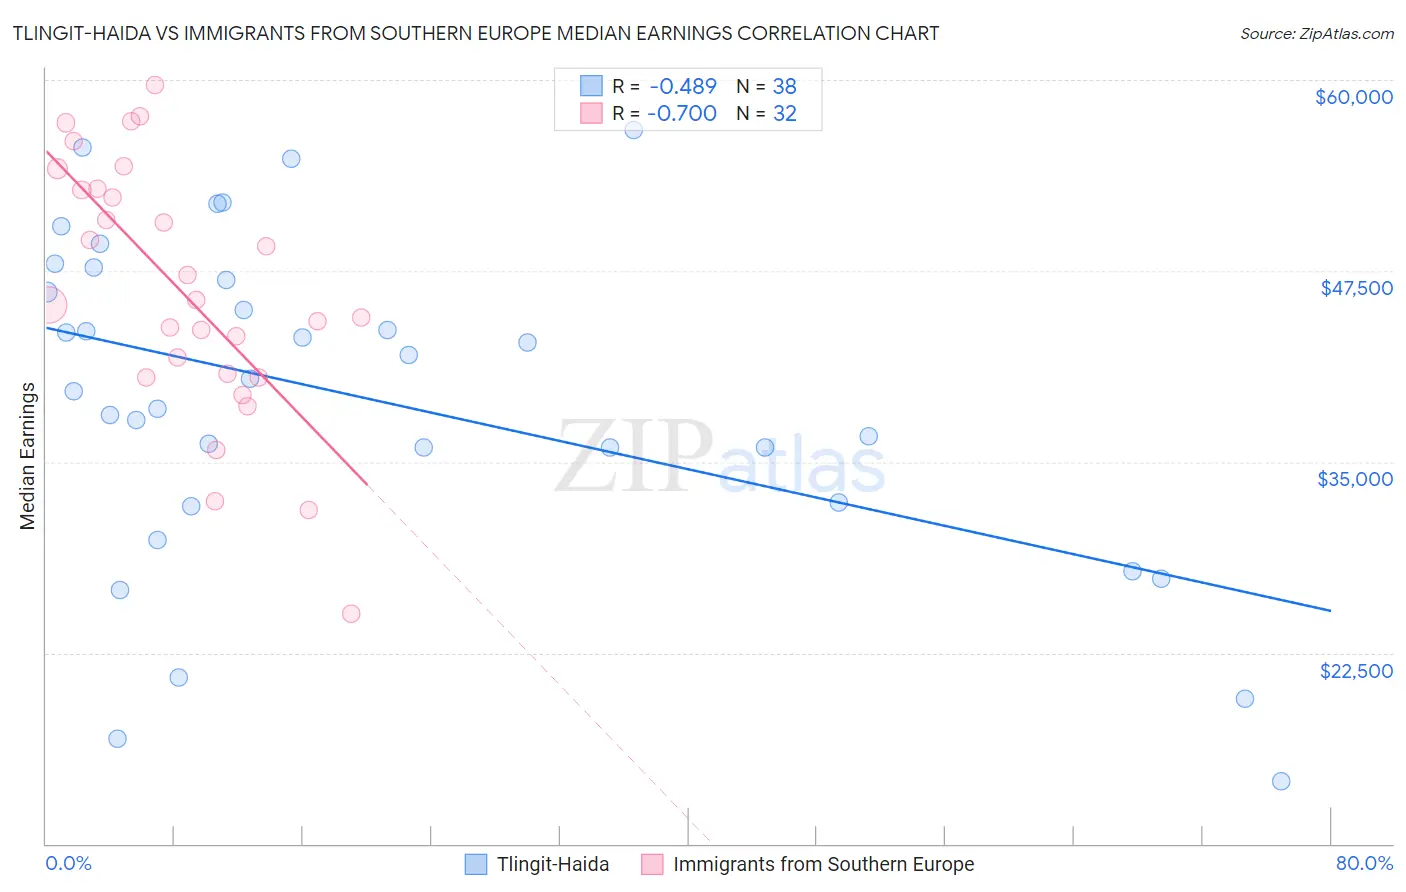
Tlingit-Haida vs Immigrants from Southern Europe Median Earnings Correlation Chart
The statistical analysis conducted on geographies consisting of 60,865,073 people shows a moderate negative correlation between the proportion of Tlingit-Haida and median earnings in the United States with a correlation coefficient (R) of -0.489 and weighted average of $45,468. Similarly, the statistical analysis conducted on geographies consisting of 402,763,457 people shows a significant negative correlation between the proportion of Immigrants from Southern Europe and median earnings in the United States with a correlation coefficient (R) of -0.700 and weighted average of $50,280, a difference of 10.6%.
Median Earnings Correlation Summary
| Measurement | Tlingit-Haida | Immigrants from Southern Europe |
| Minimum | $14,091 | $25,046 |
| Maximum | $56,765 | $59,687 |
| Range | $42,674 | $34,641 |
| Mean | $39,098 | $46,213 |
| Median | $40,018 | $45,445 |
| Interquartile 25% (IQ1) | $32,344 | $40,648 |
| Interquartile 75% (IQ3) | $46,917 | $52,864 |
| Interquartile Range (IQR) | $14,573 | $12,216 |
| Standard Deviation (Sample) | $10,751 | $8,358 |
| Standard Deviation (Population) | $10,609 | $8,227 |
Similar Demographics by Median Earnings
Demographics Similar to Tlingit-Haida by Median Earnings
In terms of median earnings, the demographic groups most similar to Tlingit-Haida are Guyanese ($45,470, a difference of 0.0%), Spanish ($45,432, a difference of 0.080%), Nigerian ($45,532, a difference of 0.14%), Immigrants from Bangladesh ($45,532, a difference of 0.14%), and Immigrants from Colombia ($45,550, a difference of 0.18%).
| Demographics | Rating | Rank | Median Earnings |
| Immigrants | Grenada | 23.6 /100 | #210 | Fair $45,596 |
| Panamanians | 23.5 /100 | #211 | Fair $45,593 |
| Bermudans | 23.5 /100 | #212 | Fair $45,593 |
| Immigrants | Colombia | 22.4 /100 | #213 | Fair $45,550 |
| Nigerians | 22.0 /100 | #214 | Fair $45,532 |
| Immigrants | Bangladesh | 22.0 /100 | #215 | Fair $45,532 |
| Guyanese | 20.6 /100 | #216 | Fair $45,470 |
| Tlingit-Haida | 20.5 /100 | #217 | Fair $45,468 |
| Spanish | 19.7 /100 | #218 | Poor $45,432 |
| Dutch | 18.4 /100 | #219 | Poor $45,370 |
| Ecuadorians | 15.3 /100 | #220 | Poor $45,214 |
| Immigrants | Guyana | 15.1 /100 | #221 | Poor $45,204 |
| Immigrants | Panama | 15.0 /100 | #222 | Poor $45,198 |
| Whites/Caucasians | 15.0 /100 | #223 | Poor $45,197 |
| West Indians | 13.9 /100 | #224 | Poor $45,132 |
Demographics Similar to Immigrants from Southern Europe by Median Earnings
In terms of median earnings, the demographic groups most similar to Immigrants from Southern Europe are Immigrants from Moldova ($50,274, a difference of 0.010%), Romanian ($50,244, a difference of 0.070%), Ukrainian ($50,320, a difference of 0.080%), Immigrants from Hungary ($50,227, a difference of 0.11%), and Immigrants from Kazakhstan ($50,225, a difference of 0.11%).
| Demographics | Rating | Rank | Median Earnings |
| South Africans | 99.8 /100 | #74 | Exceptional $50,752 |
| Immigrants | Scotland | 99.8 /100 | #75 | Exceptional $50,741 |
| Immigrants | Italy | 99.7 /100 | #76 | Exceptional $50,581 |
| Immigrants | Western Europe | 99.7 /100 | #77 | Exceptional $50,549 |
| Argentineans | 99.6 /100 | #78 | Exceptional $50,399 |
| Laotians | 99.6 /100 | #79 | Exceptional $50,343 |
| Ukrainians | 99.6 /100 | #80 | Exceptional $50,320 |
| Immigrants | Southern Europe | 99.6 /100 | #81 | Exceptional $50,280 |
| Immigrants | Moldova | 99.5 /100 | #82 | Exceptional $50,274 |
| Romanians | 99.5 /100 | #83 | Exceptional $50,244 |
| Immigrants | Hungary | 99.5 /100 | #84 | Exceptional $50,227 |
| Immigrants | Kazakhstan | 99.5 /100 | #85 | Exceptional $50,225 |
| Immigrants | Canada | 99.5 /100 | #86 | Exceptional $50,192 |
| Immigrants | Uzbekistan | 99.5 /100 | #87 | Exceptional $50,151 |
| Albanians | 99.4 /100 | #88 | Exceptional $50,116 |