Tlingit-Haida vs Immigrants from Vietnam Median Earnings
COMPARE
Tlingit-Haida
Immigrants from Vietnam
Median Earnings
Median Earnings Comparison
Tlingit-Haida
Immigrants from Vietnam
$45,468
MEDIAN EARNINGS
20.5/ 100
METRIC RATING
217th/ 347
METRIC RANK
$47,282
MEDIAN EARNINGS
76.7/ 100
METRIC RATING
155th/ 347
METRIC RANK
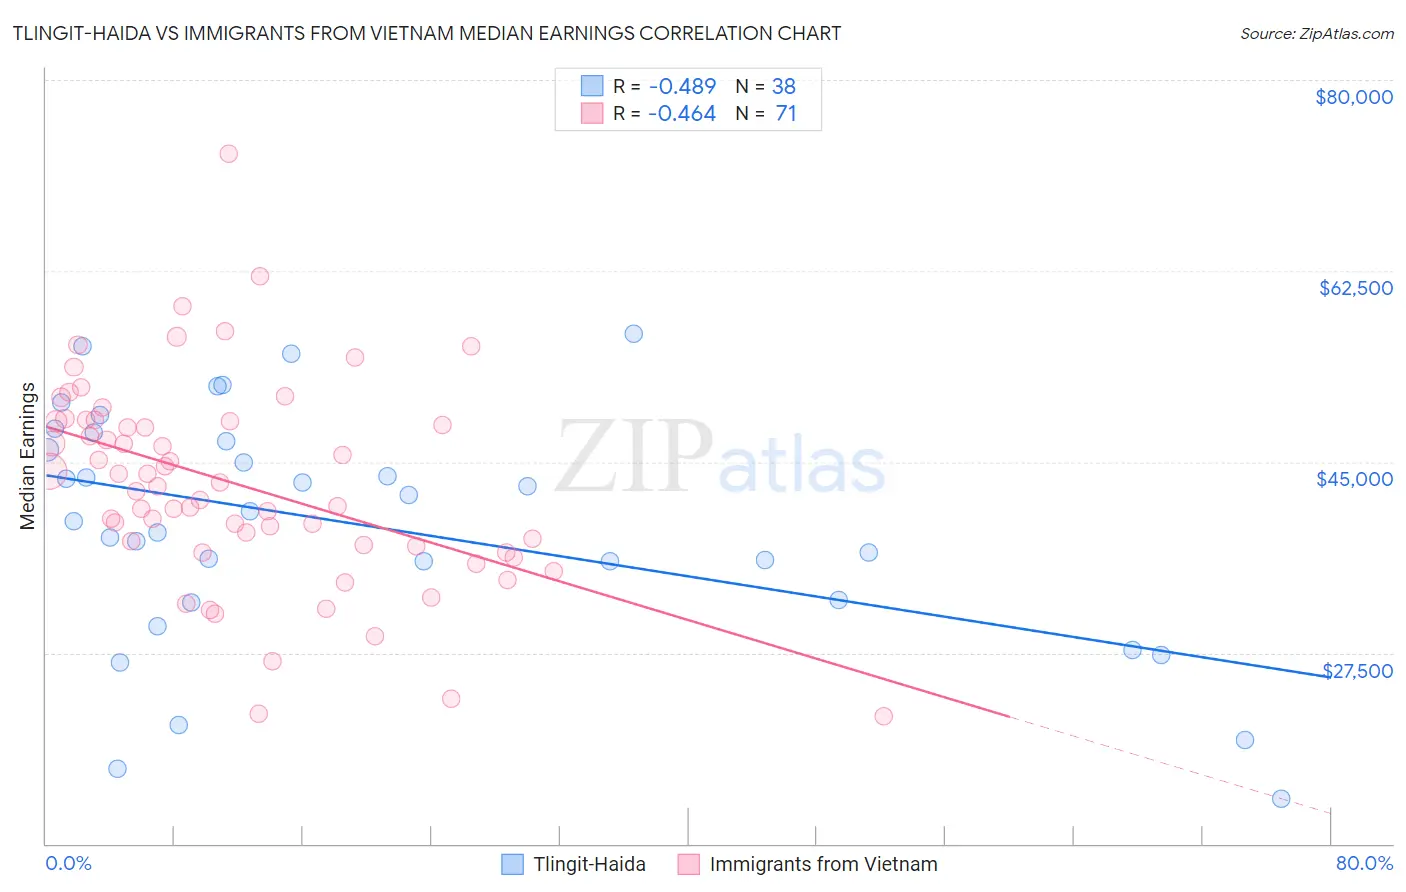
Tlingit-Haida vs Immigrants from Vietnam Median Earnings Correlation Chart
The statistical analysis conducted on geographies consisting of 60,865,073 people shows a moderate negative correlation between the proportion of Tlingit-Haida and median earnings in the United States with a correlation coefficient (R) of -0.489 and weighted average of $45,468. Similarly, the statistical analysis conducted on geographies consisting of 404,676,863 people shows a moderate negative correlation between the proportion of Immigrants from Vietnam and median earnings in the United States with a correlation coefficient (R) of -0.464 and weighted average of $47,282, a difference of 4.0%.
Median Earnings Correlation Summary
| Measurement | Tlingit-Haida | Immigrants from Vietnam |
| Minimum | $14,091 | $21,667 |
| Maximum | $56,765 | $73,212 |
| Range | $42,674 | $51,545 |
| Mean | $39,098 | $42,907 |
| Median | $40,018 | $42,737 |
| Interquartile 25% (IQ1) | $32,344 | $37,299 |
| Interquartile 75% (IQ3) | $46,917 | $48,750 |
| Interquartile Range (IQR) | $14,573 | $11,451 |
| Standard Deviation (Sample) | $10,751 | $9,399 |
| Standard Deviation (Population) | $10,609 | $9,333 |
Similar Demographics by Median Earnings
Demographics Similar to Tlingit-Haida by Median Earnings
In terms of median earnings, the demographic groups most similar to Tlingit-Haida are Guyanese ($45,470, a difference of 0.0%), Spanish ($45,432, a difference of 0.080%), Nigerian ($45,532, a difference of 0.14%), Immigrants from Bangladesh ($45,532, a difference of 0.14%), and Immigrants from Colombia ($45,550, a difference of 0.18%).
| Demographics | Rating | Rank | Median Earnings |
| Immigrants | Grenada | 23.6 /100 | #210 | Fair $45,596 |
| Panamanians | 23.5 /100 | #211 | Fair $45,593 |
| Bermudans | 23.5 /100 | #212 | Fair $45,593 |
| Immigrants | Colombia | 22.4 /100 | #213 | Fair $45,550 |
| Nigerians | 22.0 /100 | #214 | Fair $45,532 |
| Immigrants | Bangladesh | 22.0 /100 | #215 | Fair $45,532 |
| Guyanese | 20.6 /100 | #216 | Fair $45,470 |
| Tlingit-Haida | 20.5 /100 | #217 | Fair $45,468 |
| Spanish | 19.7 /100 | #218 | Poor $45,432 |
| Dutch | 18.4 /100 | #219 | Poor $45,370 |
| Ecuadorians | 15.3 /100 | #220 | Poor $45,214 |
| Immigrants | Guyana | 15.1 /100 | #221 | Poor $45,204 |
| Immigrants | Panama | 15.0 /100 | #222 | Poor $45,198 |
| Whites/Caucasians | 15.0 /100 | #223 | Poor $45,197 |
| West Indians | 13.9 /100 | #224 | Poor $45,132 |
Demographics Similar to Immigrants from Vietnam by Median Earnings
In terms of median earnings, the demographic groups most similar to Immigrants from Vietnam are Irish ($47,276, a difference of 0.010%), Immigrants from Portugal ($47,304, a difference of 0.050%), Czech ($47,221, a difference of 0.13%), Slavic ($47,470, a difference of 0.40%), and Slovak ($47,095, a difference of 0.40%).
| Demographics | Rating | Rank | Median Earnings |
| Immigrants | Eritrea | 84.8 /100 | #148 | Excellent $47,657 |
| Luxembourgers | 84.5 /100 | #149 | Excellent $47,640 |
| Peruvians | 84.2 /100 | #150 | Excellent $47,628 |
| Immigrants | Oceania | 84.1 /100 | #151 | Excellent $47,617 |
| Immigrants | Germany | 83.1 /100 | #152 | Excellent $47,566 |
| Slavs | 81.1 /100 | #153 | Excellent $47,470 |
| Immigrants | Portugal | 77.3 /100 | #154 | Good $47,304 |
| Immigrants | Vietnam | 76.7 /100 | #155 | Good $47,282 |
| Irish | 76.6 /100 | #156 | Good $47,276 |
| Czechs | 75.1 /100 | #157 | Good $47,221 |
| Slovaks | 71.7 /100 | #158 | Good $47,095 |
| Immigrants | Peru | 69.6 /100 | #159 | Good $47,025 |
| Alsatians | 69.6 /100 | #160 | Good $47,023 |
| Immigrants | Eastern Africa | 68.0 /100 | #161 | Good $46,969 |
| South American Indians | 67.4 /100 | #162 | Good $46,952 |