Slovak vs Bermudan Householder Income Over 65 years
COMPARE
Slovak
Bermudan
Householder Income Over 65 years
Householder Income Over 65 years Comparison
Slovaks
Bermudans
$59,039
HOUSEHOLDER INCOME OVER 65 YEARS
11.7/ 100
METRIC RATING
209th/ 347
METRIC RANK
$58,171
HOUSEHOLDER INCOME OVER 65 YEARS
5.1/ 100
METRIC RATING
224th/ 347
METRIC RANK
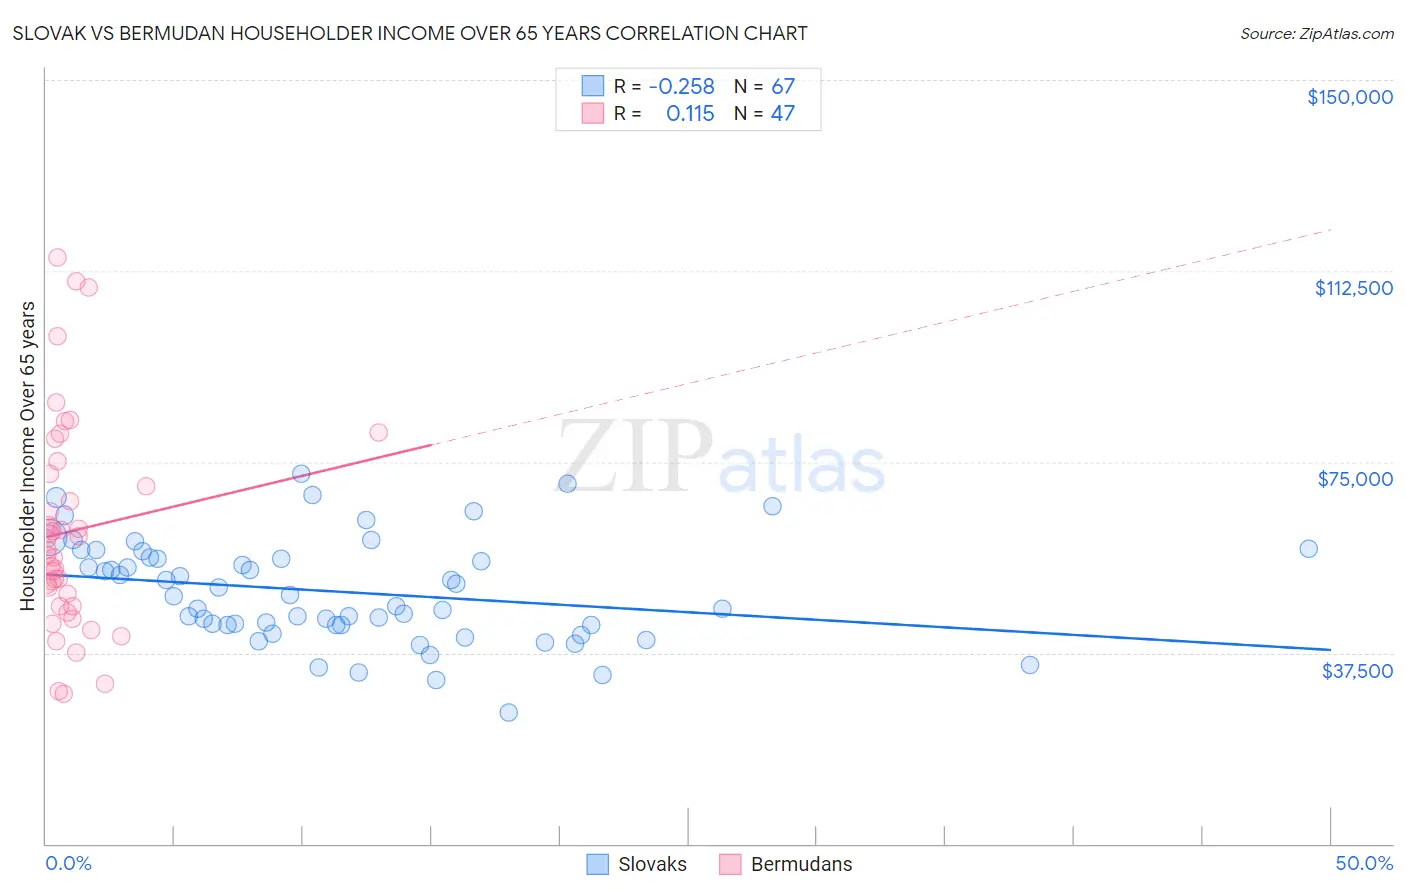
Slovak vs Bermudan Householder Income Over 65 years Correlation Chart
The statistical analysis conducted on geographies consisting of 396,632,893 people shows a weak negative correlation between the proportion of Slovaks and household income with householder over the age of 65 in the United States with a correlation coefficient (R) of -0.258 and weighted average of $59,039. Similarly, the statistical analysis conducted on geographies consisting of 55,673,391 people shows a poor positive correlation between the proportion of Bermudans and household income with householder over the age of 65 in the United States with a correlation coefficient (R) of 0.115 and weighted average of $58,171, a difference of 1.5%.
Householder Income Over 65 years Correlation Summary
| Measurement | Slovak | Bermudan |
| Minimum | $25,719 | $29,369 |
| Maximum | $72,768 | $115,179 |
| Range | $47,049 | $85,810 |
| Mean | $49,485 | $61,411 |
| Median | $48,589 | $57,809 |
| Interquartile 25% (IQ1) | $42,955 | $46,689 |
| Interquartile 75% (IQ3) | $56,267 | $72,720 |
| Interquartile Range (IQR) | $13,312 | $26,031 |
| Standard Deviation (Sample) | $10,187 | $20,368 |
| Standard Deviation (Population) | $10,111 | $20,150 |
Demographics Similar to Slovaks and Bermudans by Householder Income Over 65 years
In terms of householder income over 65 years, the demographic groups most similar to Slovaks are Nigerian ($58,992, a difference of 0.080%), Uruguayan ($59,090, a difference of 0.090%), Immigrants from Nigeria ($58,942, a difference of 0.16%), Salvadoran ($59,141, a difference of 0.17%), and Immigrants from South America ($59,151, a difference of 0.19%). Similarly, the demographic groups most similar to Bermudans are Tsimshian ($58,202, a difference of 0.050%), Delaware ($58,214, a difference of 0.080%), Immigrants from El Salvador ($58,226, a difference of 0.10%), Yugoslavian ($58,243, a difference of 0.12%), and Malaysian ($58,244, a difference of 0.13%).
| Demographics | Rating | Rank | Householder Income Over 65 years |
| Immigrants | South America | 13.0 /100 | #206 | Poor $59,151 |
| Salvadorans | 12.9 /100 | #207 | Poor $59,141 |
| Uruguayans | 12.3 /100 | #208 | Poor $59,090 |
| Slovaks | 11.7 /100 | #209 | Poor $59,039 |
| Nigerians | 11.2 /100 | #210 | Poor $58,992 |
| Immigrants | Nigeria | 10.7 /100 | #211 | Poor $58,942 |
| Colombians | 9.8 /100 | #212 | Tragic $58,851 |
| Whites/Caucasians | 9.8 /100 | #213 | Tragic $58,847 |
| Nepalese | 9.0 /100 | #214 | Tragic $58,761 |
| Immigrants | Ghana | 7.9 /100 | #215 | Tragic $58,624 |
| Immigrants | Middle Africa | 6.2 /100 | #216 | Tragic $58,375 |
| Sudanese | 5.7 /100 | #217 | Tragic $58,281 |
| Panamanians | 5.6 /100 | #218 | Tragic $58,266 |
| Malaysians | 5.5 /100 | #219 | Tragic $58,244 |
| Yugoslavians | 5.5 /100 | #220 | Tragic $58,243 |
| Immigrants | El Salvador | 5.4 /100 | #221 | Tragic $58,226 |
| Delaware | 5.3 /100 | #222 | Tragic $58,214 |
| Tsimshian | 5.2 /100 | #223 | Tragic $58,202 |
| Bermudans | 5.1 /100 | #224 | Tragic $58,171 |
| Venezuelans | 4.4 /100 | #225 | Tragic $58,026 |
| French Canadians | 4.2 /100 | #226 | Tragic $57,975 |