European vs Bermudan Householder Income Over 65 years
COMPARE
European
Bermudan
Householder Income Over 65 years
Householder Income Over 65 years Comparison
Europeans
Bermudans
$63,779
HOUSEHOLDER INCOME OVER 65 YEARS
95.0/ 100
METRIC RATING
109th/ 347
METRIC RANK
$58,171
HOUSEHOLDER INCOME OVER 65 YEARS
5.1/ 100
METRIC RATING
224th/ 347
METRIC RANK
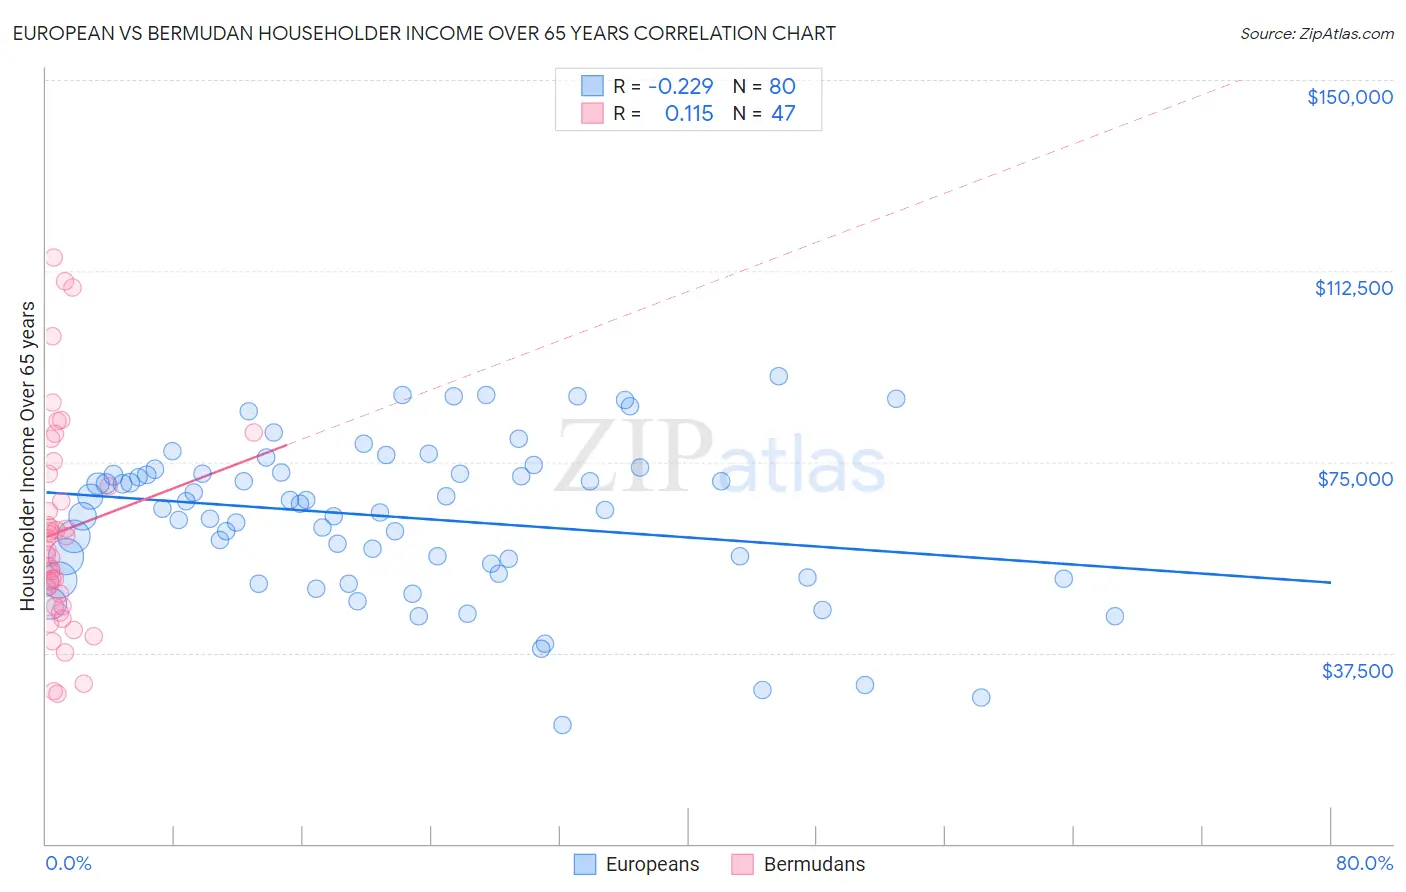
European vs Bermudan Householder Income Over 65 years Correlation Chart
The statistical analysis conducted on geographies consisting of 557,215,032 people shows a weak negative correlation between the proportion of Europeans and household income with householder over the age of 65 in the United States with a correlation coefficient (R) of -0.229 and weighted average of $63,779. Similarly, the statistical analysis conducted on geographies consisting of 55,673,391 people shows a poor positive correlation between the proportion of Bermudans and household income with householder over the age of 65 in the United States with a correlation coefficient (R) of 0.115 and weighted average of $58,171, a difference of 9.6%.
Householder Income Over 65 years Correlation Summary
| Measurement | European | Bermudan |
| Minimum | $23,269 | $29,369 |
| Maximum | $91,861 | $115,179 |
| Range | $68,592 | $85,810 |
| Mean | $64,098 | $61,411 |
| Median | $66,247 | $57,809 |
| Interquartile 25% (IQ1) | $54,019 | $46,689 |
| Interquartile 75% (IQ3) | $72,739 | $72,720 |
| Interquartile Range (IQR) | $18,720 | $26,031 |
| Standard Deviation (Sample) | $14,994 | $20,368 |
| Standard Deviation (Population) | $14,900 | $20,150 |
Similar Demographics by Householder Income Over 65 years
Demographics Similar to Europeans by Householder Income Over 65 years
In terms of householder income over 65 years, the demographic groups most similar to Europeans are Palestinian ($63,800, a difference of 0.030%), Pakistani ($63,844, a difference of 0.10%), Italian ($63,885, a difference of 0.17%), Immigrants from Argentina ($63,885, a difference of 0.17%), and Immigrants from Cameroon ($63,907, a difference of 0.20%).
| Demographics | Rating | Rank | Householder Income Over 65 years |
| Chileans | 95.8 /100 | #102 | Exceptional $63,957 |
| British | 95.7 /100 | #103 | Exceptional $63,940 |
| Immigrants | Cameroon | 95.6 /100 | #104 | Exceptional $63,907 |
| Italians | 95.5 /100 | #105 | Exceptional $63,885 |
| Immigrants | Argentina | 95.5 /100 | #106 | Exceptional $63,885 |
| Pakistanis | 95.3 /100 | #107 | Exceptional $63,844 |
| Palestinians | 95.1 /100 | #108 | Exceptional $63,800 |
| Europeans | 95.0 /100 | #109 | Exceptional $63,779 |
| Immigrants | Zimbabwe | 94.3 /100 | #110 | Exceptional $63,643 |
| Immigrants | Spain | 93.7 /100 | #111 | Exceptional $63,540 |
| Syrians | 93.4 /100 | #112 | Exceptional $63,494 |
| Immigrants | Serbia | 92.7 /100 | #113 | Exceptional $63,387 |
| Immigrants | Saudi Arabia | 92.4 /100 | #114 | Exceptional $63,355 |
| Croatians | 91.4 /100 | #115 | Exceptional $63,225 |
| Guamanians/Chamorros | 91.1 /100 | #116 | Exceptional $63,187 |
Demographics Similar to Bermudans by Householder Income Over 65 years
In terms of householder income over 65 years, the demographic groups most similar to Bermudans are Tsimshian ($58,202, a difference of 0.050%), Delaware ($58,214, a difference of 0.080%), Immigrants from El Salvador ($58,226, a difference of 0.10%), Yugoslavian ($58,243, a difference of 0.12%), and Malaysian ($58,244, a difference of 0.13%).
| Demographics | Rating | Rank | Householder Income Over 65 years |
| Sudanese | 5.7 /100 | #217 | Tragic $58,281 |
| Panamanians | 5.6 /100 | #218 | Tragic $58,266 |
| Malaysians | 5.5 /100 | #219 | Tragic $58,244 |
| Yugoslavians | 5.5 /100 | #220 | Tragic $58,243 |
| Immigrants | El Salvador | 5.4 /100 | #221 | Tragic $58,226 |
| Delaware | 5.3 /100 | #222 | Tragic $58,214 |
| Tsimshian | 5.2 /100 | #223 | Tragic $58,202 |
| Bermudans | 5.1 /100 | #224 | Tragic $58,171 |
| Venezuelans | 4.4 /100 | #225 | Tragic $58,026 |
| French Canadians | 4.2 /100 | #226 | Tragic $57,975 |
| Japanese | 3.9 /100 | #227 | Tragic $57,919 |
| Immigrants | Albania | 3.6 /100 | #228 | Tragic $57,828 |
| Immigrants | Colombia | 3.0 /100 | #229 | Tragic $57,658 |
| Immigrants | Cambodia | 2.8 /100 | #230 | Tragic $57,580 |
| Immigrants | Nonimmigrants | 2.4 /100 | #231 | Tragic $57,426 |