Tsimshian vs Bermudan Householder Income Over 65 years
COMPARE
Tsimshian
Bermudan
Householder Income Over 65 years
Householder Income Over 65 years Comparison
Tsimshian
Bermudans
$58,202
HOUSEHOLDER INCOME OVER 65 YEARS
5.2/ 100
METRIC RATING
223rd/ 347
METRIC RANK
$58,171
HOUSEHOLDER INCOME OVER 65 YEARS
5.1/ 100
METRIC RATING
224th/ 347
METRIC RANK
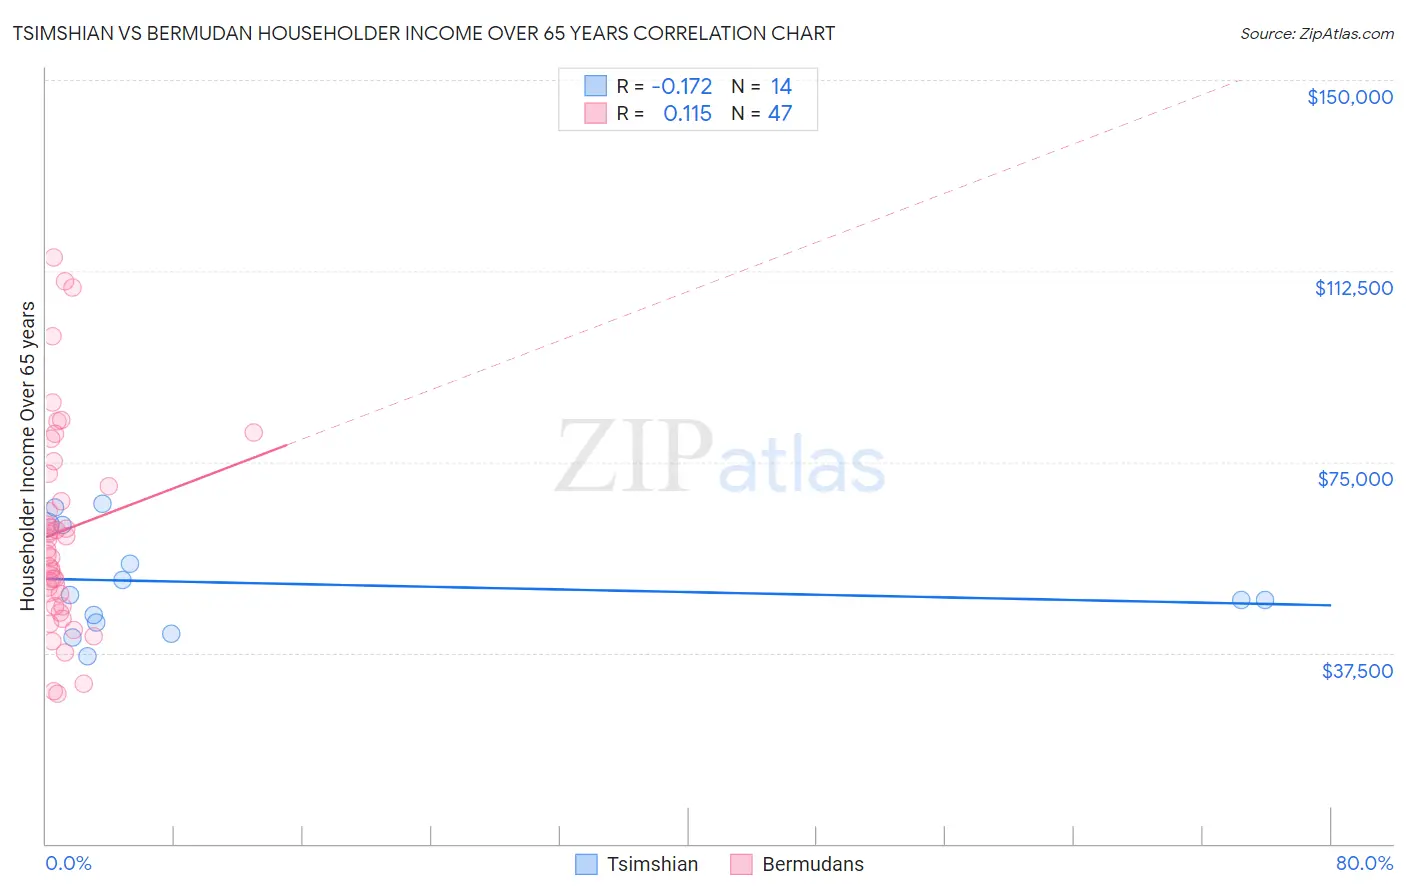
Tsimshian vs Bermudan Householder Income Over 65 years Correlation Chart
The statistical analysis conducted on geographies consisting of 15,616,590 people shows a poor negative correlation between the proportion of Tsimshian and household income with householder over the age of 65 in the United States with a correlation coefficient (R) of -0.172 and weighted average of $58,202. Similarly, the statistical analysis conducted on geographies consisting of 55,673,391 people shows a poor positive correlation between the proportion of Bermudans and household income with householder over the age of 65 in the United States with a correlation coefficient (R) of 0.115 and weighted average of $58,171, a difference of 0.050%.
Householder Income Over 65 years Correlation Summary
| Measurement | Tsimshian | Bermudan |
| Minimum | $36,937 | $29,369 |
| Maximum | $66,667 | $115,179 |
| Range | $29,730 | $85,810 |
| Mean | $51,164 | $61,411 |
| Median | $48,373 | $57,809 |
| Interquartile 25% (IQ1) | $43,571 | $46,689 |
| Interquartile 75% (IQ3) | $62,589 | $72,720 |
| Interquartile Range (IQR) | $19,018 | $26,031 |
| Standard Deviation (Sample) | $9,918 | $20,368 |
| Standard Deviation (Population) | $9,557 | $20,150 |
Demographics Similar to Tsimshian and Bermudans by Householder Income Over 65 years
In terms of householder income over 65 years, the demographic groups most similar to Tsimshian are Delaware ($58,214, a difference of 0.020%), Immigrants from El Salvador ($58,226, a difference of 0.040%), Malaysian ($58,244, a difference of 0.070%), Yugoslavian ($58,243, a difference of 0.070%), and Panamanian ($58,266, a difference of 0.11%). Similarly, the demographic groups most similar to Bermudans are Delaware ($58,214, a difference of 0.080%), Immigrants from El Salvador ($58,226, a difference of 0.10%), Yugoslavian ($58,243, a difference of 0.12%), Malaysian ($58,244, a difference of 0.13%), and Panamanian ($58,266, a difference of 0.16%).
| Demographics | Rating | Rank | Householder Income Over 65 years |
| Whites/Caucasians | 9.8 /100 | #213 | Tragic $58,847 |
| Nepalese | 9.0 /100 | #214 | Tragic $58,761 |
| Immigrants | Ghana | 7.9 /100 | #215 | Tragic $58,624 |
| Immigrants | Middle Africa | 6.2 /100 | #216 | Tragic $58,375 |
| Sudanese | 5.7 /100 | #217 | Tragic $58,281 |
| Panamanians | 5.6 /100 | #218 | Tragic $58,266 |
| Malaysians | 5.5 /100 | #219 | Tragic $58,244 |
| Yugoslavians | 5.5 /100 | #220 | Tragic $58,243 |
| Immigrants | El Salvador | 5.4 /100 | #221 | Tragic $58,226 |
| Delaware | 5.3 /100 | #222 | Tragic $58,214 |
| Tsimshian | 5.2 /100 | #223 | Tragic $58,202 |
| Bermudans | 5.1 /100 | #224 | Tragic $58,171 |
| Venezuelans | 4.4 /100 | #225 | Tragic $58,026 |
| French Canadians | 4.2 /100 | #226 | Tragic $57,975 |
| Japanese | 3.9 /100 | #227 | Tragic $57,919 |
| Immigrants | Albania | 3.6 /100 | #228 | Tragic $57,828 |
| Immigrants | Colombia | 3.0 /100 | #229 | Tragic $57,658 |
| Immigrants | Cambodia | 2.8 /100 | #230 | Tragic $57,580 |
| Immigrants | Nonimmigrants | 2.4 /100 | #231 | Tragic $57,426 |
| Immigrants | Venezuela | 2.3 /100 | #232 | Tragic $57,371 |
| Immigrants | Western Africa | 1.7 /100 | #233 | Tragic $57,119 |