Taiwanese vs Apache Median Earnings
COMPARE
Taiwanese
Apache
Median Earnings
Median Earnings Comparison
Taiwanese
Apache
$47,902
MEDIAN EARNINGS
88.7/ 100
METRIC RATING
140th/ 347
METRIC RANK
$40,388
MEDIAN EARNINGS
0.0/ 100
METRIC RATING
310th/ 347
METRIC RANK
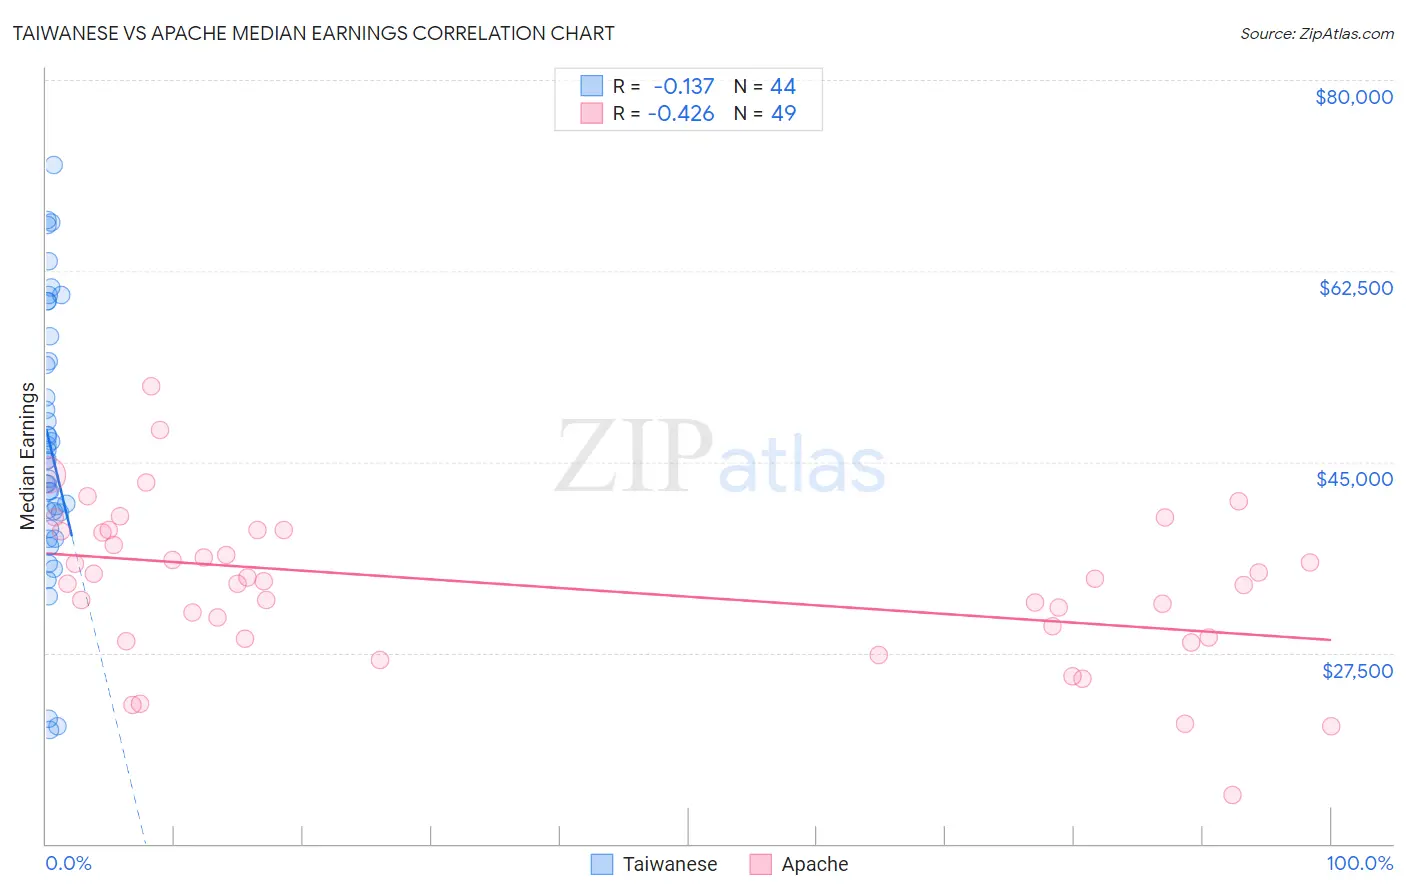
Taiwanese vs Apache Median Earnings Correlation Chart
The statistical analysis conducted on geographies consisting of 31,724,936 people shows a poor negative correlation between the proportion of Taiwanese and median earnings in the United States with a correlation coefficient (R) of -0.137 and weighted average of $47,902. Similarly, the statistical analysis conducted on geographies consisting of 231,119,863 people shows a moderate negative correlation between the proportion of Apache and median earnings in the United States with a correlation coefficient (R) of -0.426 and weighted average of $40,388, a difference of 18.6%.
Median Earnings Correlation Summary
| Measurement | Taiwanese | Apache |
| Minimum | $20,462 | $14,458 |
| Maximum | $72,258 | $51,892 |
| Range | $51,796 | $37,433 |
| Mean | $46,503 | $33,634 |
| Median | $45,096 | $34,056 |
| Interquartile 25% (IQ1) | $39,605 | $28,886 |
| Interquartile 75% (IQ3) | $55,414 | $38,705 |
| Interquartile Range (IQR) | $15,809 | $9,819 |
| Standard Deviation (Sample) | $12,277 | $7,141 |
| Standard Deviation (Population) | $12,137 | $7,068 |
Similar Demographics by Median Earnings
Demographics Similar to Taiwanese by Median Earnings
In terms of median earnings, the demographic groups most similar to Taiwanese are Canadian ($47,911, a difference of 0.020%), European ($47,915, a difference of 0.030%), Immigrants from Nepal ($47,925, a difference of 0.050%), Immigrants from Sierra Leone ($47,875, a difference of 0.060%), and Ugandan ($47,854, a difference of 0.10%).
| Demographics | Rating | Rank | Median Earnings |
| Immigrants | Uganda | 90.5 /100 | #133 | Exceptional $48,041 |
| Sri Lankans | 90.5 /100 | #134 | Exceptional $48,040 |
| Portuguese | 90.4 /100 | #135 | Exceptional $48,032 |
| Slovenes | 90.0 /100 | #136 | Excellent $47,995 |
| Immigrants | Nepal | 89.0 /100 | #137 | Excellent $47,925 |
| Europeans | 88.9 /100 | #138 | Excellent $47,915 |
| Canadians | 88.8 /100 | #139 | Excellent $47,911 |
| Taiwanese | 88.7 /100 | #140 | Excellent $47,902 |
| Immigrants | Sierra Leone | 88.3 /100 | #141 | Excellent $47,875 |
| Ugandans | 88.0 /100 | #142 | Excellent $47,854 |
| Swedes | 88.0 /100 | #143 | Excellent $47,851 |
| Hungarians | 87.1 /100 | #144 | Excellent $47,795 |
| Immigrants | Saudi Arabia | 85.6 /100 | #145 | Excellent $47,704 |
| Immigrants | Chile | 85.5 /100 | #146 | Excellent $47,697 |
| Immigrants | South Eastern Asia | 85.0 /100 | #147 | Excellent $47,671 |
Demographics Similar to Apache by Median Earnings
In terms of median earnings, the demographic groups most similar to Apache are Hispanic or Latino ($40,288, a difference of 0.25%), Chippewa ($40,287, a difference of 0.25%), Choctaw ($40,270, a difference of 0.29%), Cheyenne ($40,233, a difference of 0.39%), and Seminole ($40,233, a difference of 0.39%).
| Demographics | Rating | Rank | Median Earnings |
| Haitians | 0.0 /100 | #303 | Tragic $40,918 |
| Immigrants | Guatemala | 0.0 /100 | #304 | Tragic $40,851 |
| Chickasaw | 0.0 /100 | #305 | Tragic $40,672 |
| Yaqui | 0.0 /100 | #306 | Tragic $40,647 |
| Hondurans | 0.0 /100 | #307 | Tragic $40,638 |
| Cubans | 0.0 /100 | #308 | Tragic $40,619 |
| Immigrants | Haiti | 0.0 /100 | #309 | Tragic $40,550 |
| Apache | 0.0 /100 | #310 | Tragic $40,388 |
| Hispanics or Latinos | 0.0 /100 | #311 | Tragic $40,288 |
| Chippewa | 0.0 /100 | #312 | Tragic $40,287 |
| Choctaw | 0.0 /100 | #313 | Tragic $40,270 |
| Cheyenne | 0.0 /100 | #314 | Tragic $40,233 |
| Seminole | 0.0 /100 | #315 | Tragic $40,233 |
| Immigrants | Honduras | 0.0 /100 | #316 | Tragic $40,195 |
| Fijians | 0.0 /100 | #317 | Tragic $40,193 |