Somali vs Apache Median Earnings
COMPARE
Somali
Apache
Median Earnings
Median Earnings Comparison
Somalis
Apache
$43,567
MEDIAN EARNINGS
1.8/ 100
METRIC RATING
253rd/ 347
METRIC RANK
$40,388
MEDIAN EARNINGS
0.0/ 100
METRIC RATING
310th/ 347
METRIC RANK
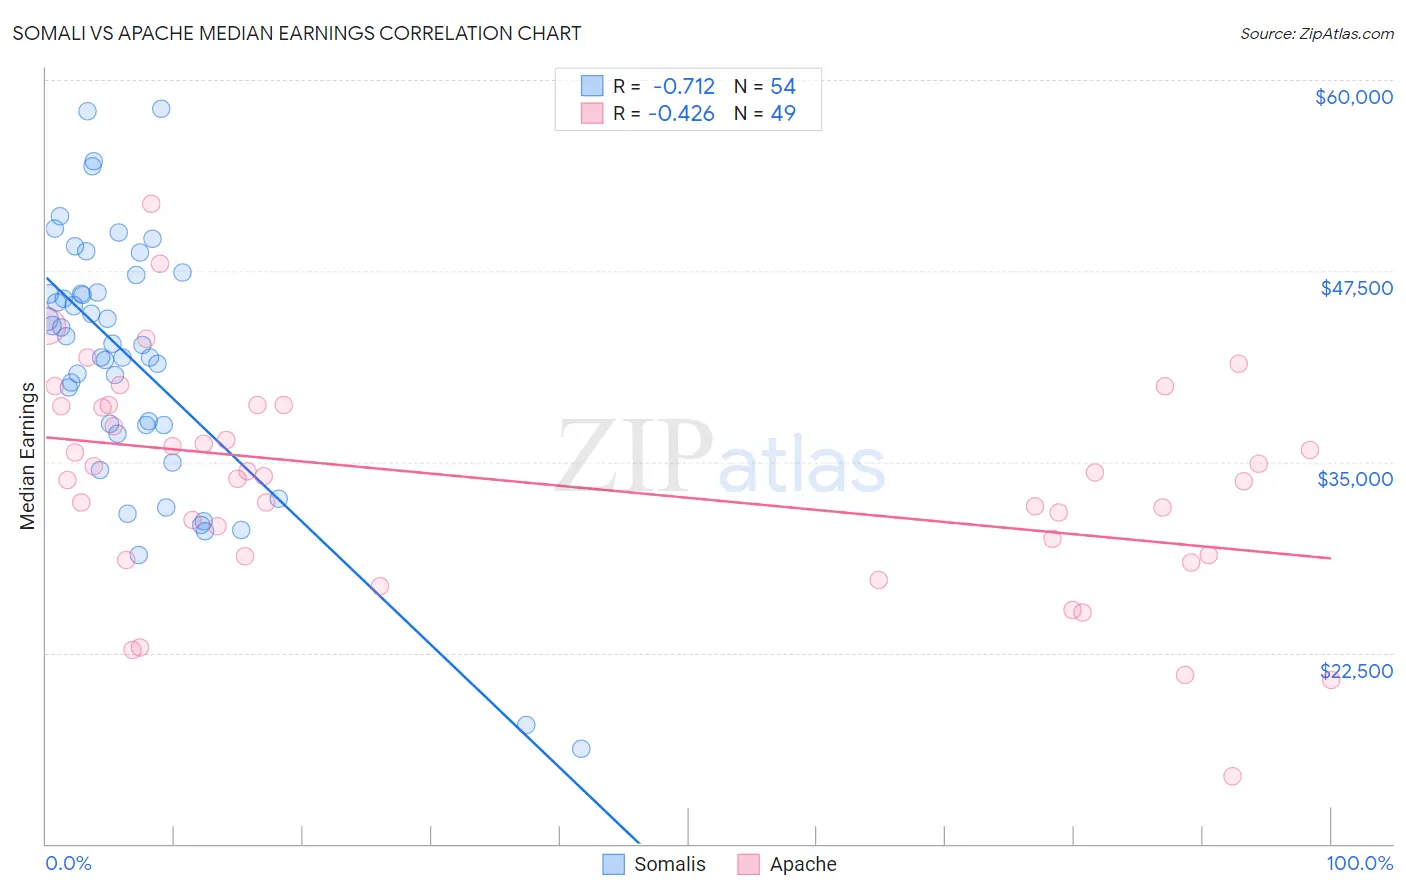
Somali vs Apache Median Earnings Correlation Chart
The statistical analysis conducted on geographies consisting of 99,321,613 people shows a strong negative correlation between the proportion of Somalis and median earnings in the United States with a correlation coefficient (R) of -0.712 and weighted average of $43,567. Similarly, the statistical analysis conducted on geographies consisting of 231,119,863 people shows a moderate negative correlation between the proportion of Apache and median earnings in the United States with a correlation coefficient (R) of -0.426 and weighted average of $40,388, a difference of 7.9%.
Median Earnings Correlation Summary
| Measurement | Somali | Apache |
| Minimum | $16,214 | $14,458 |
| Maximum | $58,125 | $51,892 |
| Range | $41,911 | $37,433 |
| Mean | $41,593 | $33,634 |
| Median | $42,677 | $34,056 |
| Interquartile 25% (IQ1) | $37,388 | $28,886 |
| Interquartile 75% (IQ3) | $46,056 | $38,705 |
| Interquartile Range (IQR) | $8,668 | $9,819 |
| Standard Deviation (Sample) | $8,542 | $7,141 |
| Standard Deviation (Population) | $8,463 | $7,068 |
Similar Demographics by Median Earnings
Demographics Similar to Somalis by Median Earnings
In terms of median earnings, the demographic groups most similar to Somalis are Liberian ($43,536, a difference of 0.070%), Hawaiian ($43,673, a difference of 0.24%), Tsimshian ($43,695, a difference of 0.30%), Immigrants from Middle Africa ($43,416, a difference of 0.35%), and Alaskan Athabascan ($43,393, a difference of 0.40%).
| Demographics | Rating | Rank | Median Earnings |
| Immigrants | West Indies | 3.1 /100 | #246 | Tragic $43,989 |
| Immigrants | Cabo Verde | 3.0 /100 | #247 | Tragic $43,963 |
| Nepalese | 2.6 /100 | #248 | Tragic $43,860 |
| Malaysians | 2.6 /100 | #249 | Tragic $43,844 |
| Alaska Natives | 2.3 /100 | #250 | Tragic $43,750 |
| Tsimshian | 2.1 /100 | #251 | Tragic $43,695 |
| Hawaiians | 2.0 /100 | #252 | Tragic $43,673 |
| Somalis | 1.8 /100 | #253 | Tragic $43,567 |
| Liberians | 1.7 /100 | #254 | Tragic $43,536 |
| Immigrants | Middle Africa | 1.4 /100 | #255 | Tragic $43,416 |
| Alaskan Athabascans | 1.4 /100 | #256 | Tragic $43,393 |
| Jamaicans | 1.3 /100 | #257 | Tragic $43,343 |
| French American Indians | 1.3 /100 | #258 | Tragic $43,333 |
| German Russians | 1.1 /100 | #259 | Tragic $43,200 |
| Immigrants | Somalia | 0.9 /100 | #260 | Tragic $43,100 |
Demographics Similar to Apache by Median Earnings
In terms of median earnings, the demographic groups most similar to Apache are Hispanic or Latino ($40,288, a difference of 0.25%), Chippewa ($40,287, a difference of 0.25%), Choctaw ($40,270, a difference of 0.29%), Cheyenne ($40,233, a difference of 0.39%), and Seminole ($40,233, a difference of 0.39%).
| Demographics | Rating | Rank | Median Earnings |
| Haitians | 0.0 /100 | #303 | Tragic $40,918 |
| Immigrants | Guatemala | 0.0 /100 | #304 | Tragic $40,851 |
| Chickasaw | 0.0 /100 | #305 | Tragic $40,672 |
| Yaqui | 0.0 /100 | #306 | Tragic $40,647 |
| Hondurans | 0.0 /100 | #307 | Tragic $40,638 |
| Cubans | 0.0 /100 | #308 | Tragic $40,619 |
| Immigrants | Haiti | 0.0 /100 | #309 | Tragic $40,550 |
| Apache | 0.0 /100 | #310 | Tragic $40,388 |
| Hispanics or Latinos | 0.0 /100 | #311 | Tragic $40,288 |
| Chippewa | 0.0 /100 | #312 | Tragic $40,287 |
| Choctaw | 0.0 /100 | #313 | Tragic $40,270 |
| Cheyenne | 0.0 /100 | #314 | Tragic $40,233 |
| Seminole | 0.0 /100 | #315 | Tragic $40,233 |
| Immigrants | Honduras | 0.0 /100 | #316 | Tragic $40,195 |
| Fijians | 0.0 /100 | #317 | Tragic $40,193 |