Taiwanese vs Cherokee Median Earnings
COMPARE
Taiwanese
Cherokee
Median Earnings
Median Earnings Comparison
Taiwanese
Cherokee
$47,902
MEDIAN EARNINGS
88.7/ 100
METRIC RATING
140th/ 347
METRIC RANK
$41,252
MEDIAN EARNINGS
0.1/ 100
METRIC RATING
296th/ 347
METRIC RANK
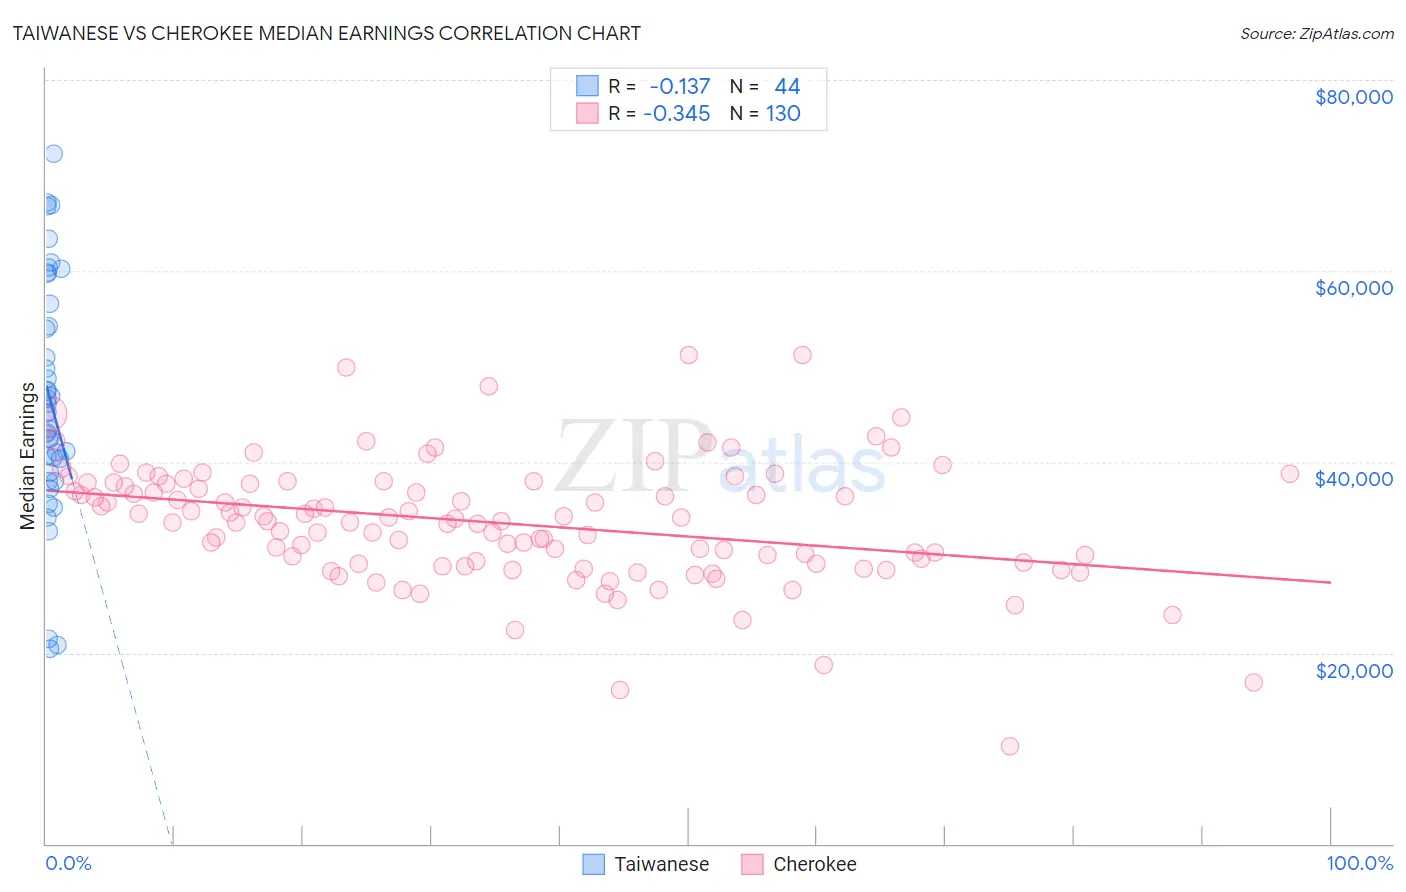
Taiwanese vs Cherokee Median Earnings Correlation Chart
The statistical analysis conducted on geographies consisting of 31,724,936 people shows a poor negative correlation between the proportion of Taiwanese and median earnings in the United States with a correlation coefficient (R) of -0.137 and weighted average of $47,902. Similarly, the statistical analysis conducted on geographies consisting of 493,557,174 people shows a mild negative correlation between the proportion of Cherokee and median earnings in the United States with a correlation coefficient (R) of -0.345 and weighted average of $41,252, a difference of 16.1%.
Median Earnings Correlation Summary
| Measurement | Taiwanese | Cherokee |
| Minimum | $20,462 | $10,267 |
| Maximum | $72,258 | $51,250 |
| Range | $51,796 | $40,983 |
| Mean | $46,503 | $33,603 |
| Median | $45,096 | $33,784 |
| Interquartile 25% (IQ1) | $39,605 | $29,375 |
| Interquartile 75% (IQ3) | $55,414 | $37,767 |
| Interquartile Range (IQR) | $15,809 | $8,392 |
| Standard Deviation (Sample) | $12,277 | $6,429 |
| Standard Deviation (Population) | $12,137 | $6,404 |
Similar Demographics by Median Earnings
Demographics Similar to Taiwanese by Median Earnings
In terms of median earnings, the demographic groups most similar to Taiwanese are Canadian ($47,911, a difference of 0.020%), European ($47,915, a difference of 0.030%), Immigrants from Nepal ($47,925, a difference of 0.050%), Immigrants from Sierra Leone ($47,875, a difference of 0.060%), and Ugandan ($47,854, a difference of 0.10%).
| Demographics | Rating | Rank | Median Earnings |
| Immigrants | Uganda | 90.5 /100 | #133 | Exceptional $48,041 |
| Sri Lankans | 90.5 /100 | #134 | Exceptional $48,040 |
| Portuguese | 90.4 /100 | #135 | Exceptional $48,032 |
| Slovenes | 90.0 /100 | #136 | Excellent $47,995 |
| Immigrants | Nepal | 89.0 /100 | #137 | Excellent $47,925 |
| Europeans | 88.9 /100 | #138 | Excellent $47,915 |
| Canadians | 88.8 /100 | #139 | Excellent $47,911 |
| Taiwanese | 88.7 /100 | #140 | Excellent $47,902 |
| Immigrants | Sierra Leone | 88.3 /100 | #141 | Excellent $47,875 |
| Ugandans | 88.0 /100 | #142 | Excellent $47,854 |
| Swedes | 88.0 /100 | #143 | Excellent $47,851 |
| Hungarians | 87.1 /100 | #144 | Excellent $47,795 |
| Immigrants | Saudi Arabia | 85.6 /100 | #145 | Excellent $47,704 |
| Immigrants | Chile | 85.5 /100 | #146 | Excellent $47,697 |
| Immigrants | South Eastern Asia | 85.0 /100 | #147 | Excellent $47,671 |
Demographics Similar to Cherokee by Median Earnings
In terms of median earnings, the demographic groups most similar to Cherokee are Bangladeshi ($41,263, a difference of 0.030%), Potawatomi ($41,288, a difference of 0.090%), Guatemalan ($41,205, a difference of 0.11%), Immigrants from Zaire ($41,325, a difference of 0.18%), and Immigrants from Micronesia ($41,133, a difference of 0.29%).
| Demographics | Rating | Rank | Median Earnings |
| Comanche | 0.1 /100 | #289 | Tragic $41,519 |
| Paiute | 0.1 /100 | #290 | Tragic $41,508 |
| Central American Indians | 0.1 /100 | #291 | Tragic $41,474 |
| U.S. Virgin Islanders | 0.1 /100 | #292 | Tragic $41,448 |
| Immigrants | Zaire | 0.1 /100 | #293 | Tragic $41,325 |
| Potawatomi | 0.1 /100 | #294 | Tragic $41,288 |
| Bangladeshis | 0.1 /100 | #295 | Tragic $41,263 |
| Cherokee | 0.1 /100 | #296 | Tragic $41,252 |
| Guatemalans | 0.1 /100 | #297 | Tragic $41,205 |
| Immigrants | Micronesia | 0.1 /100 | #298 | Tragic $41,133 |
| Immigrants | Caribbean | 0.1 /100 | #299 | Tragic $41,119 |
| Ute | 0.1 /100 | #300 | Tragic $41,051 |
| Immigrants | Latin America | 0.1 /100 | #301 | Tragic $41,049 |
| Shoshone | 0.0 /100 | #302 | Tragic $40,932 |
| Haitians | 0.0 /100 | #303 | Tragic $40,918 |