Taiwanese vs Apache No Schooling Completed
COMPARE
Taiwanese
Apache
No Schooling Completed
No Schooling Completed Comparison
Taiwanese
Apache
2.5%
NO SCHOOLING COMPLETED
0.3/ 100
METRIC RATING
268th/ 347
METRIC RANK
2.1%
NO SCHOOLING COMPLETED
56.7/ 100
METRIC RATING
169th/ 347
METRIC RANK
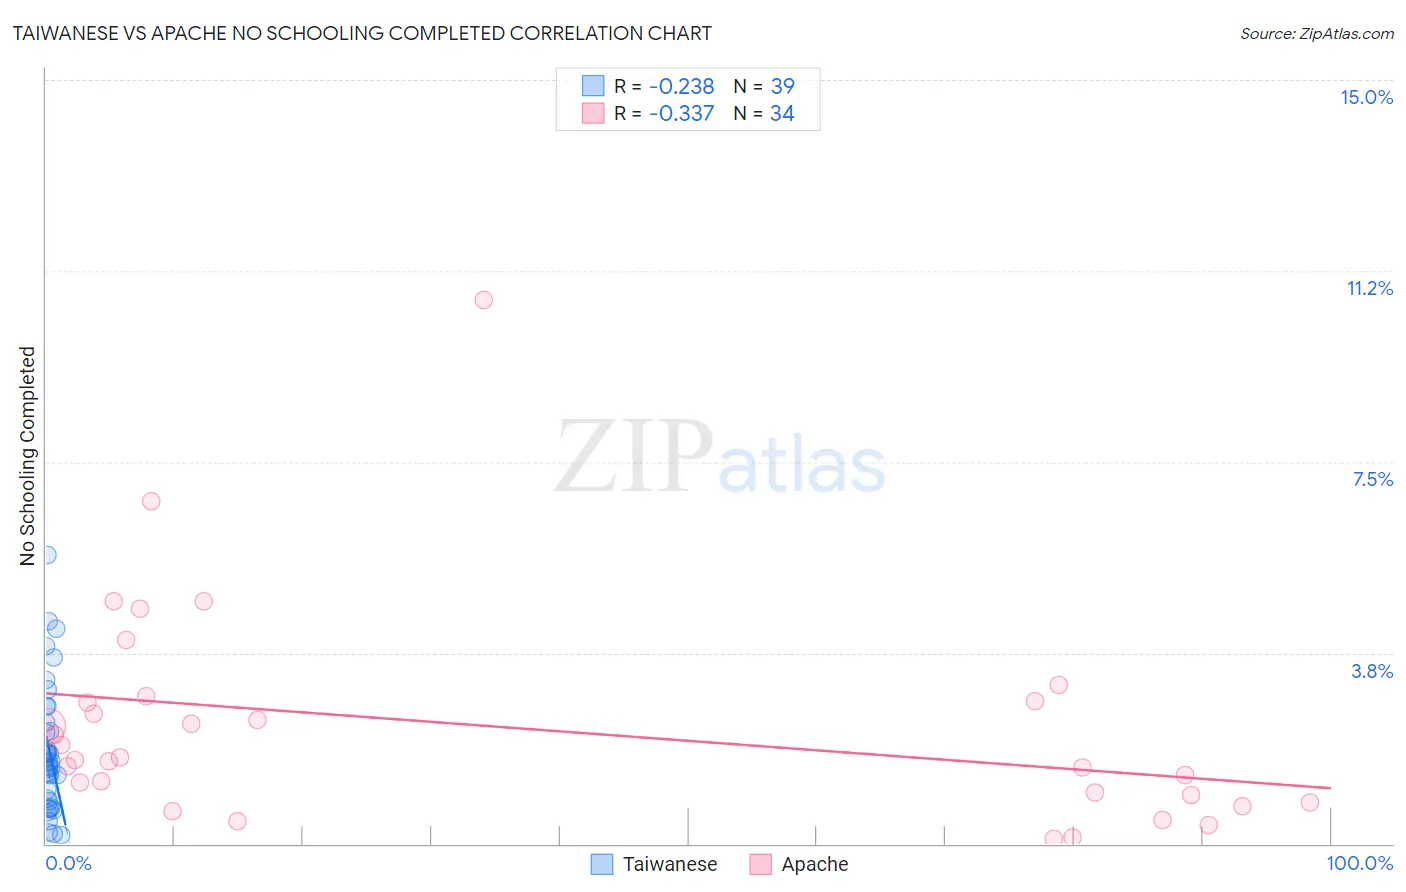
Taiwanese vs Apache No Schooling Completed Correlation Chart
The statistical analysis conducted on geographies consisting of 31,647,627 people shows a weak negative correlation between the proportion of Taiwanese and percentage of population with no schooling in the United States with a correlation coefficient (R) of -0.238 and weighted average of 2.5%. Similarly, the statistical analysis conducted on geographies consisting of 229,858,613 people shows a mild negative correlation between the proportion of Apache and percentage of population with no schooling in the United States with a correlation coefficient (R) of -0.337 and weighted average of 2.1%, a difference of 20.2%.
No Schooling Completed Correlation Summary
| Measurement | Taiwanese | Apache |
| Minimum | 0.18% | 0.098% |
| Maximum | 5.7% | 10.7% |
| Range | 5.5% | 10.6% |
| Mean | 1.8% | 2.3% |
| Median | 1.6% | 1.7% |
| Interquartile 25% (IQ1) | 0.84% | 0.95% |
| Interquartile 75% (IQ3) | 2.4% | 2.8% |
| Interquartile Range (IQR) | 1.5% | 1.9% |
| Standard Deviation (Sample) | 1.3% | 2.1% |
| Standard Deviation (Population) | 1.2% | 2.1% |
Similar Demographics by No Schooling Completed
Demographics Similar to Taiwanese by No Schooling Completed
In terms of no schooling completed, the demographic groups most similar to Taiwanese are Yuman (2.5%, a difference of 0.26%), Fijian (2.5%, a difference of 0.44%), West Indian (2.5%, a difference of 0.51%), Indian (Asian) (2.5%, a difference of 0.70%), and Immigrants from Liberia (2.5%, a difference of 0.83%).
| Demographics | Rating | Rank | No Schooling Completed |
| Armenians | 0.5 /100 | #261 | Tragic 2.5% |
| Immigrants | Sierra Leone | 0.5 /100 | #262 | Tragic 2.5% |
| Immigrants | Liberia | 0.4 /100 | #263 | Tragic 2.5% |
| Indians (Asian) | 0.4 /100 | #264 | Tragic 2.5% |
| West Indians | 0.4 /100 | #265 | Tragic 2.5% |
| Fijians | 0.4 /100 | #266 | Tragic 2.5% |
| Yuman | 0.4 /100 | #267 | Tragic 2.5% |
| Taiwanese | 0.3 /100 | #268 | Tragic 2.5% |
| Immigrants | Nigeria | 0.2 /100 | #269 | Tragic 2.5% |
| Immigrants | Peru | 0.2 /100 | #270 | Tragic 2.5% |
| Cubans | 0.2 /100 | #271 | Tragic 2.5% |
| Immigrants | Bolivia | 0.2 /100 | #272 | Tragic 2.5% |
| Immigrants | Cameroon | 0.1 /100 | #273 | Tragic 2.5% |
| Ghanaians | 0.1 /100 | #274 | Tragic 2.6% |
| Immigrants | China | 0.1 /100 | #275 | Tragic 2.6% |
Demographics Similar to Apache by No Schooling Completed
In terms of no schooling completed, the demographic groups most similar to Apache are Argentinean (2.1%, a difference of 0.090%), Immigrants from Poland (2.1%, a difference of 0.20%), Cheyenne (2.1%, a difference of 0.27%), Egyptian (2.1%, a difference of 0.35%), and Dutch West Indian (2.1%, a difference of 0.46%).
| Demographics | Rating | Rank | No Schooling Completed |
| Immigrants | Brazil | 63.8 /100 | #162 | Good 2.1% |
| Albanians | 62.2 /100 | #163 | Good 2.1% |
| Comanche | 60.7 /100 | #164 | Good 2.1% |
| Brazilians | 60.2 /100 | #165 | Good 2.1% |
| Dutch West Indians | 59.9 /100 | #166 | Average 2.1% |
| Egyptians | 59.2 /100 | #167 | Average 2.1% |
| Cheyenne | 58.6 /100 | #168 | Average 2.1% |
| Apache | 56.7 /100 | #169 | Average 2.1% |
| Argentineans | 56.0 /100 | #170 | Average 2.1% |
| Immigrants | Poland | 55.2 /100 | #171 | Average 2.1% |
| Immigrants | Argentina | 52.7 /100 | #172 | Average 2.1% |
| Immigrants | Belarus | 51.8 /100 | #173 | Average 2.1% |
| Immigrants | Micronesia | 50.0 /100 | #174 | Average 2.1% |
| Arabs | 46.4 /100 | #175 | Average 2.1% |
| Panamanians | 45.2 /100 | #176 | Average 2.1% |