Taiwanese vs Basque Median Earnings
COMPARE
Taiwanese
Basque
Median Earnings
Median Earnings Comparison
Taiwanese
Basques
$47,902
MEDIAN EARNINGS
88.7/ 100
METRIC RATING
140th/ 347
METRIC RANK
$46,399
MEDIAN EARNINGS
48.8/ 100
METRIC RATING
175th/ 347
METRIC RANK
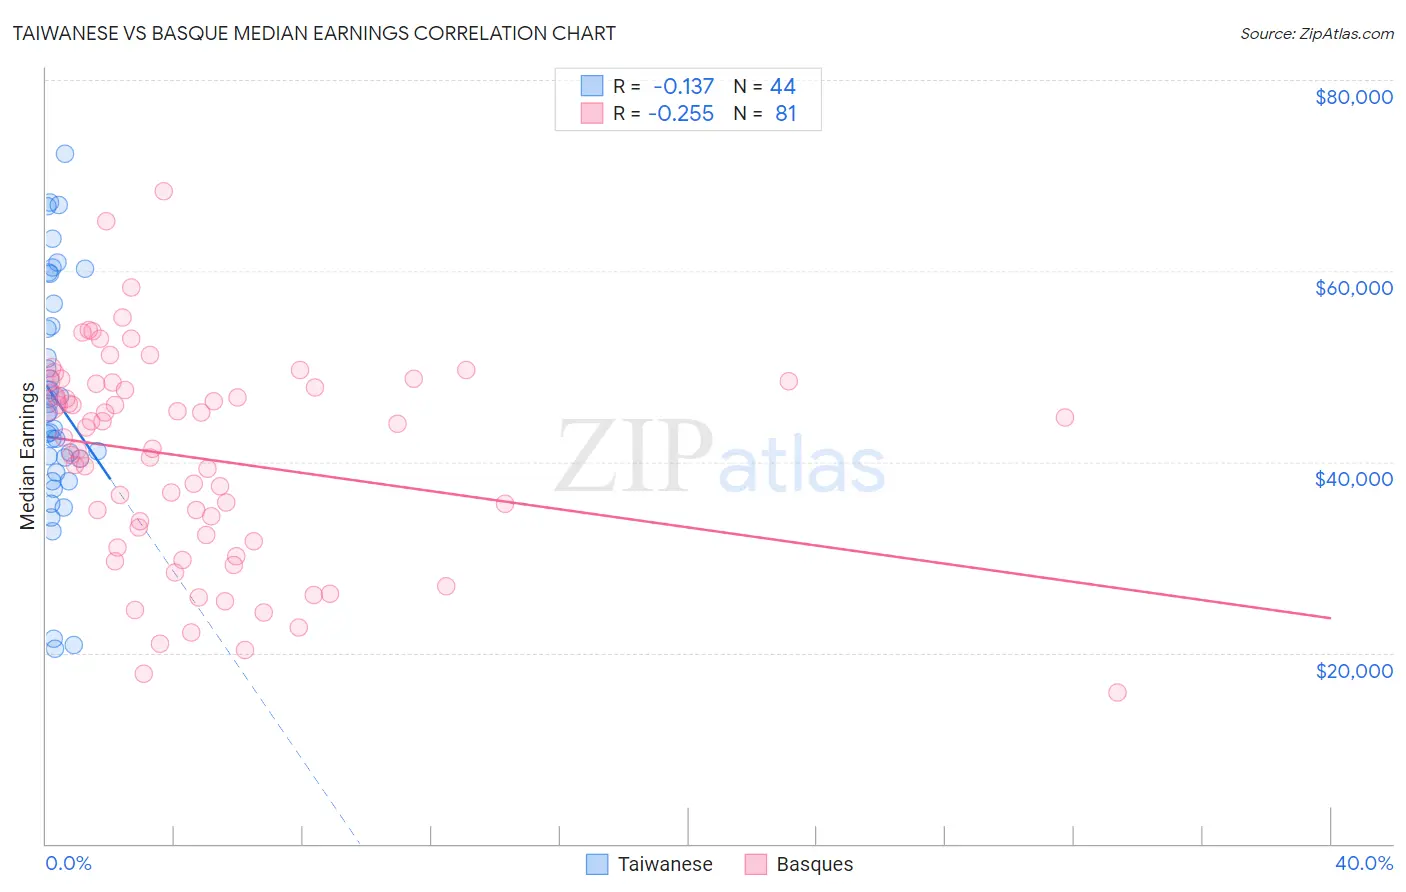
Taiwanese vs Basque Median Earnings Correlation Chart
The statistical analysis conducted on geographies consisting of 31,724,936 people shows a poor negative correlation between the proportion of Taiwanese and median earnings in the United States with a correlation coefficient (R) of -0.137 and weighted average of $47,902. Similarly, the statistical analysis conducted on geographies consisting of 165,772,846 people shows a weak negative correlation between the proportion of Basques and median earnings in the United States with a correlation coefficient (R) of -0.255 and weighted average of $46,399, a difference of 3.2%.
Median Earnings Correlation Summary
| Measurement | Taiwanese | Basque |
| Minimum | $20,462 | $15,833 |
| Maximum | $72,258 | $68,304 |
| Range | $51,796 | $52,471 |
| Mean | $46,503 | $40,382 |
| Median | $45,096 | $42,566 |
| Interquartile 25% (IQ1) | $39,605 | $32,007 |
| Interquartile 75% (IQ3) | $55,414 | $48,221 |
| Interquartile Range (IQR) | $15,809 | $16,214 |
| Standard Deviation (Sample) | $12,277 | $10,903 |
| Standard Deviation (Population) | $12,137 | $10,835 |
Similar Demographics by Median Earnings
Demographics Similar to Taiwanese by Median Earnings
In terms of median earnings, the demographic groups most similar to Taiwanese are Canadian ($47,911, a difference of 0.020%), European ($47,915, a difference of 0.030%), Immigrants from Nepal ($47,925, a difference of 0.050%), Immigrants from Sierra Leone ($47,875, a difference of 0.060%), and Ugandan ($47,854, a difference of 0.10%).
| Demographics | Rating | Rank | Median Earnings |
| Immigrants | Uganda | 90.5 /100 | #133 | Exceptional $48,041 |
| Sri Lankans | 90.5 /100 | #134 | Exceptional $48,040 |
| Portuguese | 90.4 /100 | #135 | Exceptional $48,032 |
| Slovenes | 90.0 /100 | #136 | Excellent $47,995 |
| Immigrants | Nepal | 89.0 /100 | #137 | Excellent $47,925 |
| Europeans | 88.9 /100 | #138 | Excellent $47,915 |
| Canadians | 88.8 /100 | #139 | Excellent $47,911 |
| Taiwanese | 88.7 /100 | #140 | Excellent $47,902 |
| Immigrants | Sierra Leone | 88.3 /100 | #141 | Excellent $47,875 |
| Ugandans | 88.0 /100 | #142 | Excellent $47,854 |
| Swedes | 88.0 /100 | #143 | Excellent $47,851 |
| Hungarians | 87.1 /100 | #144 | Excellent $47,795 |
| Immigrants | Saudi Arabia | 85.6 /100 | #145 | Excellent $47,704 |
| Immigrants | Chile | 85.5 /100 | #146 | Excellent $47,697 |
| Immigrants | South Eastern Asia | 85.0 /100 | #147 | Excellent $47,671 |
Demographics Similar to Basques by Median Earnings
In terms of median earnings, the demographic groups most similar to Basques are Danish ($46,392, a difference of 0.020%), Belgian ($46,375, a difference of 0.050%), Scandinavian ($46,433, a difference of 0.070%), Ghanaian ($46,440, a difference of 0.090%), and Colombian ($46,349, a difference of 0.11%).
| Demographics | Rating | Rank | Median Earnings |
| Immigrants | Africa | 54.6 /100 | #168 | Average $46,564 |
| Immigrants | South America | 54.0 /100 | #169 | Average $46,548 |
| Immigrants | Immigrants | 51.6 /100 | #170 | Average $46,478 |
| Scottish | 51.1 /100 | #171 | Average $46,463 |
| Kenyans | 51.0 /100 | #172 | Average $46,462 |
| Ghanaians | 50.3 /100 | #173 | Average $46,440 |
| Scandinavians | 50.0 /100 | #174 | Average $46,433 |
| Basques | 48.8 /100 | #175 | Average $46,399 |
| Danes | 48.6 /100 | #176 | Average $46,392 |
| Belgians | 48.0 /100 | #177 | Average $46,375 |
| Colombians | 47.1 /100 | #178 | Average $46,349 |
| English | 46.5 /100 | #179 | Average $46,334 |
| Puget Sound Salish | 46.5 /100 | #180 | Average $46,333 |
| Immigrants | Cameroon | 46.4 /100 | #181 | Average $46,329 |
| Swiss | 45.9 /100 | #182 | Average $46,315 |