Immigrants from Pakistan vs Apache Median Earnings
COMPARE
Immigrants from Pakistan
Apache
Median Earnings
Median Earnings Comparison
Immigrants from Pakistan
Apache
$51,693
MEDIAN EARNINGS
99.9/ 100
METRIC RATING
56th/ 347
METRIC RANK
$40,388
MEDIAN EARNINGS
0.0/ 100
METRIC RATING
310th/ 347
METRIC RANK
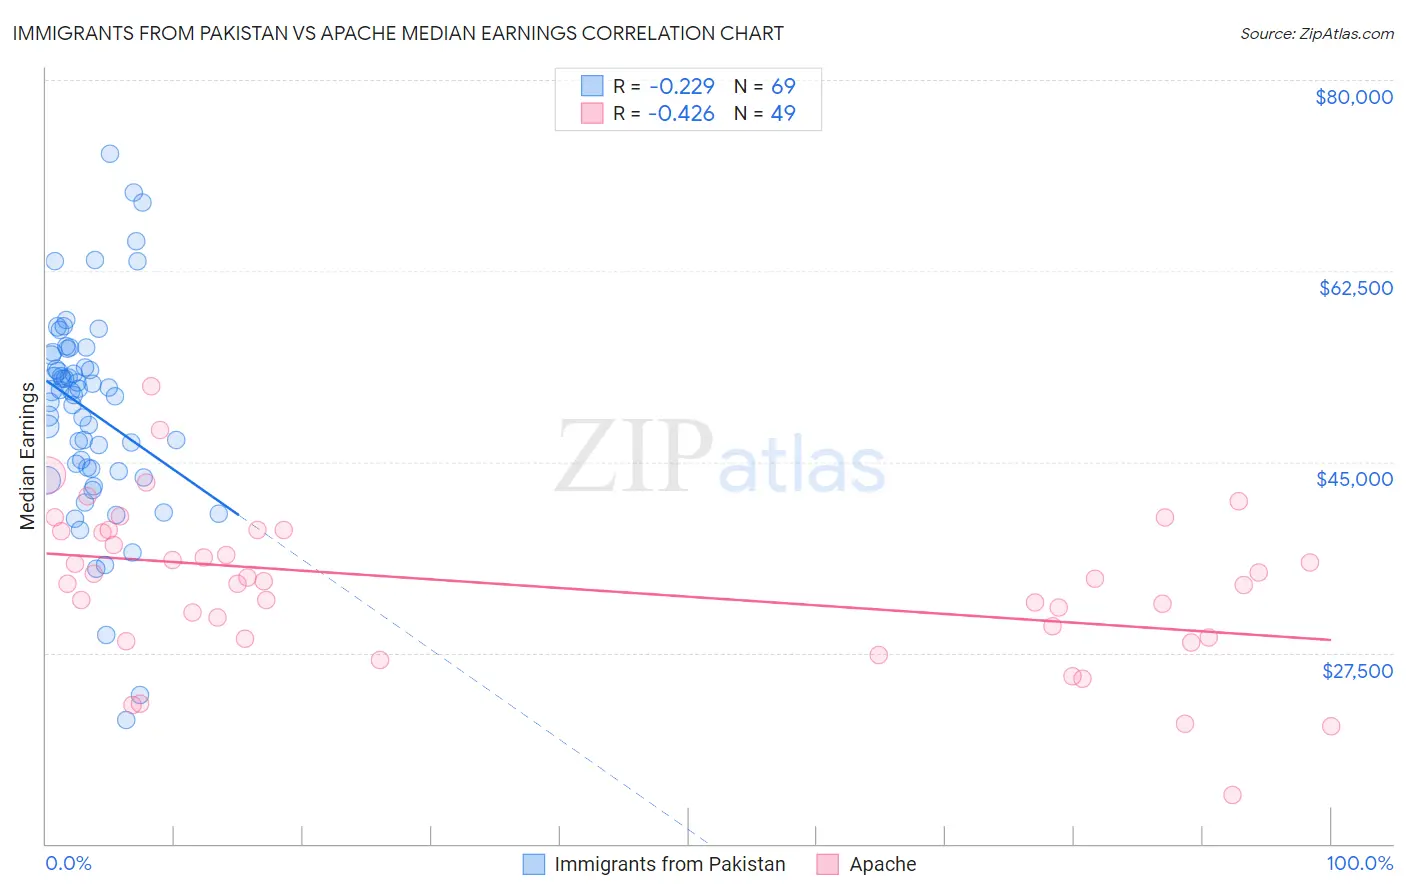
Immigrants from Pakistan vs Apache Median Earnings Correlation Chart
The statistical analysis conducted on geographies consisting of 283,895,517 people shows a weak negative correlation between the proportion of Immigrants from Pakistan and median earnings in the United States with a correlation coefficient (R) of -0.229 and weighted average of $51,693. Similarly, the statistical analysis conducted on geographies consisting of 231,119,863 people shows a moderate negative correlation between the proportion of Apache and median earnings in the United States with a correlation coefficient (R) of -0.426 and weighted average of $40,388, a difference of 28.0%.
Median Earnings Correlation Summary
| Measurement | Immigrants from Pakistan | Apache |
| Minimum | $21,371 | $14,458 |
| Maximum | $73,220 | $51,892 |
| Range | $51,849 | $37,433 |
| Mean | $49,677 | $33,634 |
| Median | $51,477 | $34,056 |
| Interquartile 25% (IQ1) | $44,262 | $28,886 |
| Interquartile 75% (IQ3) | $54,915 | $38,705 |
| Interquartile Range (IQR) | $10,654 | $9,819 |
| Standard Deviation (Sample) | $9,518 | $7,141 |
| Standard Deviation (Population) | $9,449 | $7,068 |
Similar Demographics by Median Earnings
Demographics Similar to Immigrants from Pakistan by Median Earnings
In terms of median earnings, the demographic groups most similar to Immigrants from Pakistan are Egyptian ($51,701, a difference of 0.010%), Immigrants from Indonesia ($51,715, a difference of 0.040%), Immigrants from Norway ($51,758, a difference of 0.13%), Immigrants from Eastern Europe ($51,624, a difference of 0.13%), and Estonian ($51,772, a difference of 0.15%).
| Demographics | Rating | Rank | Median Earnings |
| Bolivians | 100.0 /100 | #49 | Exceptional $52,005 |
| Immigrants | South Africa | 100.0 /100 | #50 | Exceptional $51,850 |
| Immigrants | Austria | 99.9 /100 | #51 | Exceptional $51,826 |
| Estonians | 99.9 /100 | #52 | Exceptional $51,772 |
| Immigrants | Norway | 99.9 /100 | #53 | Exceptional $51,758 |
| Immigrants | Indonesia | 99.9 /100 | #54 | Exceptional $51,715 |
| Egyptians | 99.9 /100 | #55 | Exceptional $51,701 |
| Immigrants | Pakistan | 99.9 /100 | #56 | Exceptional $51,693 |
| Immigrants | Eastern Europe | 99.9 /100 | #57 | Exceptional $51,624 |
| Immigrants | Bolivia | 99.9 /100 | #58 | Exceptional $51,605 |
| Immigrants | Croatia | 99.9 /100 | #59 | Exceptional $51,581 |
| Immigrants | Serbia | 99.9 /100 | #60 | Exceptional $51,557 |
| Immigrants | Latvia | 99.9 /100 | #61 | Exceptional $51,555 |
| Immigrants | Romania | 99.9 /100 | #62 | Exceptional $51,337 |
| Immigrants | Bulgaria | 99.9 /100 | #63 | Exceptional $51,318 |
Demographics Similar to Apache by Median Earnings
In terms of median earnings, the demographic groups most similar to Apache are Hispanic or Latino ($40,288, a difference of 0.25%), Chippewa ($40,287, a difference of 0.25%), Choctaw ($40,270, a difference of 0.29%), Cheyenne ($40,233, a difference of 0.39%), and Seminole ($40,233, a difference of 0.39%).
| Demographics | Rating | Rank | Median Earnings |
| Haitians | 0.0 /100 | #303 | Tragic $40,918 |
| Immigrants | Guatemala | 0.0 /100 | #304 | Tragic $40,851 |
| Chickasaw | 0.0 /100 | #305 | Tragic $40,672 |
| Yaqui | 0.0 /100 | #306 | Tragic $40,647 |
| Hondurans | 0.0 /100 | #307 | Tragic $40,638 |
| Cubans | 0.0 /100 | #308 | Tragic $40,619 |
| Immigrants | Haiti | 0.0 /100 | #309 | Tragic $40,550 |
| Apache | 0.0 /100 | #310 | Tragic $40,388 |
| Hispanics or Latinos | 0.0 /100 | #311 | Tragic $40,288 |
| Chippewa | 0.0 /100 | #312 | Tragic $40,287 |
| Choctaw | 0.0 /100 | #313 | Tragic $40,270 |
| Cheyenne | 0.0 /100 | #314 | Tragic $40,233 |
| Seminole | 0.0 /100 | #315 | Tragic $40,233 |
| Immigrants | Honduras | 0.0 /100 | #316 | Tragic $40,195 |
| Fijians | 0.0 /100 | #317 | Tragic $40,193 |