Choctaw vs Apache Median Earnings
COMPARE
Choctaw
Apache
Median Earnings
Median Earnings Comparison
Choctaw
Apache
$40,270
MEDIAN EARNINGS
0.0/ 100
METRIC RATING
313th/ 347
METRIC RANK
$40,388
MEDIAN EARNINGS
0.0/ 100
METRIC RATING
310th/ 347
METRIC RANK
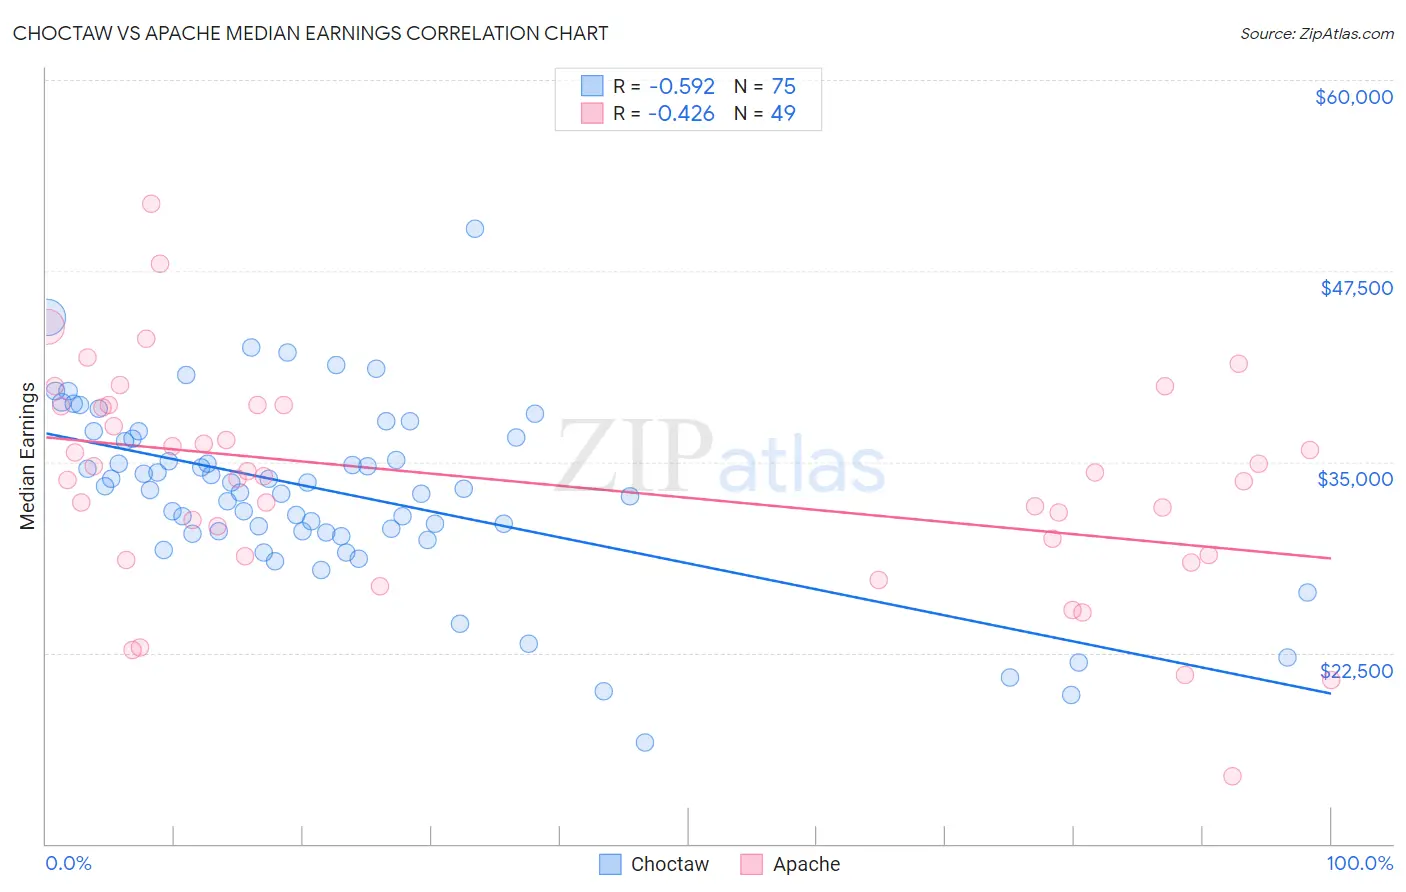
Choctaw vs Apache Median Earnings Correlation Chart
The statistical analysis conducted on geographies consisting of 269,709,236 people shows a substantial negative correlation between the proportion of Choctaw and median earnings in the United States with a correlation coefficient (R) of -0.592 and weighted average of $40,270. Similarly, the statistical analysis conducted on geographies consisting of 231,119,863 people shows a moderate negative correlation between the proportion of Apache and median earnings in the United States with a correlation coefficient (R) of -0.426 and weighted average of $40,388, a difference of 0.29%.
Median Earnings Correlation Summary
| Measurement | Choctaw | Apache |
| Minimum | $16,607 | $14,458 |
| Maximum | $50,240 | $51,892 |
| Range | $33,633 | $37,433 |
| Mean | $33,003 | $33,634 |
| Median | $33,256 | $34,056 |
| Interquartile 25% (IQ1) | $30,391 | $28,886 |
| Interquartile 75% (IQ3) | $36,563 | $38,705 |
| Interquartile Range (IQR) | $6,172 | $9,819 |
| Standard Deviation (Sample) | $5,920 | $7,141 |
| Standard Deviation (Population) | $5,880 | $7,068 |
Demographics Similar to Choctaw and Apache by Median Earnings
In terms of median earnings, the demographic groups most similar to Choctaw are Hispanic or Latino ($40,288, a difference of 0.040%), Chippewa ($40,287, a difference of 0.040%), Cheyenne ($40,233, a difference of 0.090%), Seminole ($40,233, a difference of 0.090%), and Immigrants from Honduras ($40,195, a difference of 0.19%). Similarly, the demographic groups most similar to Apache are Hispanic or Latino ($40,288, a difference of 0.25%), Chippewa ($40,287, a difference of 0.25%), Cheyenne ($40,233, a difference of 0.39%), Seminole ($40,233, a difference of 0.39%), and Immigrants from Haiti ($40,550, a difference of 0.40%).
| Demographics | Rating | Rank | Median Earnings |
| Immigrants | Latin America | 0.1 /100 | #301 | Tragic $41,049 |
| Shoshone | 0.0 /100 | #302 | Tragic $40,932 |
| Haitians | 0.0 /100 | #303 | Tragic $40,918 |
| Immigrants | Guatemala | 0.0 /100 | #304 | Tragic $40,851 |
| Chickasaw | 0.0 /100 | #305 | Tragic $40,672 |
| Yaqui | 0.0 /100 | #306 | Tragic $40,647 |
| Hondurans | 0.0 /100 | #307 | Tragic $40,638 |
| Cubans | 0.0 /100 | #308 | Tragic $40,619 |
| Immigrants | Haiti | 0.0 /100 | #309 | Tragic $40,550 |
| Apache | 0.0 /100 | #310 | Tragic $40,388 |
| Hispanics or Latinos | 0.0 /100 | #311 | Tragic $40,288 |
| Chippewa | 0.0 /100 | #312 | Tragic $40,287 |
| Choctaw | 0.0 /100 | #313 | Tragic $40,270 |
| Cheyenne | 0.0 /100 | #314 | Tragic $40,233 |
| Seminole | 0.0 /100 | #315 | Tragic $40,233 |
| Immigrants | Honduras | 0.0 /100 | #316 | Tragic $40,195 |
| Fijians | 0.0 /100 | #317 | Tragic $40,193 |
| Dutch West Indians | 0.0 /100 | #318 | Tragic $40,107 |
| Blacks/African Americans | 0.0 /100 | #319 | Tragic $40,085 |
| Immigrants | Bahamas | 0.0 /100 | #320 | Tragic $39,861 |
| Mexicans | 0.0 /100 | #321 | Tragic $39,834 |