Taiwanese vs Immigrants from Argentina Median Earnings
COMPARE
Taiwanese
Immigrants from Argentina
Median Earnings
Median Earnings Comparison
Taiwanese
Immigrants from Argentina
$47,902
MEDIAN EARNINGS
88.7/ 100
METRIC RATING
140th/ 347
METRIC RANK
$49,841
MEDIAN EARNINGS
99.2/ 100
METRIC RATING
92nd/ 347
METRIC RANK
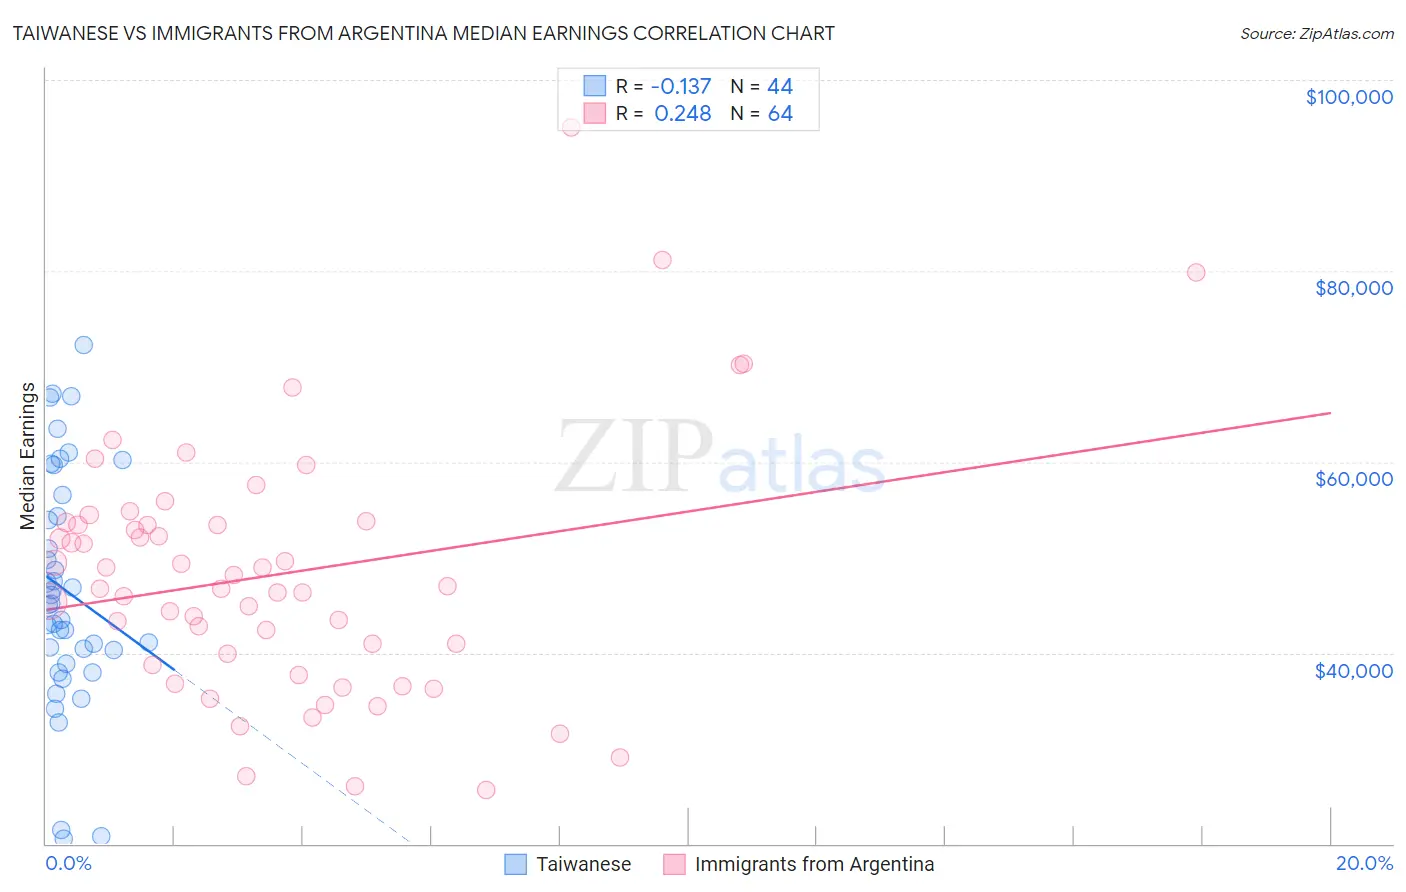
Taiwanese vs Immigrants from Argentina Median Earnings Correlation Chart
The statistical analysis conducted on geographies consisting of 31,724,936 people shows a poor negative correlation between the proportion of Taiwanese and median earnings in the United States with a correlation coefficient (R) of -0.137 and weighted average of $47,902. Similarly, the statistical analysis conducted on geographies consisting of 264,409,503 people shows a weak positive correlation between the proportion of Immigrants from Argentina and median earnings in the United States with a correlation coefficient (R) of 0.248 and weighted average of $49,841, a difference of 4.1%.
Median Earnings Correlation Summary
| Measurement | Taiwanese | Immigrants from Argentina |
| Minimum | $20,462 | $25,634 |
| Maximum | $72,258 | $94,961 |
| Range | $51,796 | $69,327 |
| Mean | $46,503 | $48,229 |
| Median | $45,096 | $46,837 |
| Interquartile 25% (IQ1) | $39,605 | $39,341 |
| Interquartile 75% (IQ3) | $55,414 | $53,567 |
| Interquartile Range (IQR) | $15,809 | $14,226 |
| Standard Deviation (Sample) | $12,277 | $13,180 |
| Standard Deviation (Population) | $12,137 | $13,077 |
Similar Demographics by Median Earnings
Demographics Similar to Taiwanese by Median Earnings
In terms of median earnings, the demographic groups most similar to Taiwanese are Canadian ($47,911, a difference of 0.020%), European ($47,915, a difference of 0.030%), Immigrants from Nepal ($47,925, a difference of 0.050%), Immigrants from Sierra Leone ($47,875, a difference of 0.060%), and Ugandan ($47,854, a difference of 0.10%).
| Demographics | Rating | Rank | Median Earnings |
| Immigrants | Uganda | 90.5 /100 | #133 | Exceptional $48,041 |
| Sri Lankans | 90.5 /100 | #134 | Exceptional $48,040 |
| Portuguese | 90.4 /100 | #135 | Exceptional $48,032 |
| Slovenes | 90.0 /100 | #136 | Excellent $47,995 |
| Immigrants | Nepal | 89.0 /100 | #137 | Excellent $47,925 |
| Europeans | 88.9 /100 | #138 | Excellent $47,915 |
| Canadians | 88.8 /100 | #139 | Excellent $47,911 |
| Taiwanese | 88.7 /100 | #140 | Excellent $47,902 |
| Immigrants | Sierra Leone | 88.3 /100 | #141 | Excellent $47,875 |
| Ugandans | 88.0 /100 | #142 | Excellent $47,854 |
| Swedes | 88.0 /100 | #143 | Excellent $47,851 |
| Hungarians | 87.1 /100 | #144 | Excellent $47,795 |
| Immigrants | Saudi Arabia | 85.6 /100 | #145 | Excellent $47,704 |
| Immigrants | Chile | 85.5 /100 | #146 | Excellent $47,697 |
| Immigrants | South Eastern Asia | 85.0 /100 | #147 | Excellent $47,671 |
Demographics Similar to Immigrants from Argentina by Median Earnings
In terms of median earnings, the demographic groups most similar to Immigrants from Argentina are Armenian ($49,804, a difference of 0.070%), Macedonian ($49,893, a difference of 0.11%), Italian ($49,915, a difference of 0.15%), Croatian ($49,724, a difference of 0.23%), and Immigrants from England ($49,722, a difference of 0.24%).
| Demographics | Rating | Rank | Median Earnings |
| Immigrants | Kazakhstan | 99.5 /100 | #85 | Exceptional $50,225 |
| Immigrants | Canada | 99.5 /100 | #86 | Exceptional $50,192 |
| Immigrants | Uzbekistan | 99.5 /100 | #87 | Exceptional $50,151 |
| Albanians | 99.4 /100 | #88 | Exceptional $50,116 |
| Immigrants | North America | 99.4 /100 | #89 | Exceptional $50,108 |
| Italians | 99.3 /100 | #90 | Exceptional $49,915 |
| Macedonians | 99.2 /100 | #91 | Exceptional $49,893 |
| Immigrants | Argentina | 99.2 /100 | #92 | Exceptional $49,841 |
| Armenians | 99.1 /100 | #93 | Exceptional $49,804 |
| Croatians | 99.0 /100 | #94 | Exceptional $49,724 |
| Immigrants | England | 99.0 /100 | #95 | Exceptional $49,722 |
| Immigrants | Lebanon | 99.0 /100 | #96 | Exceptional $49,682 |
| Immigrants | North Macedonia | 98.9 /100 | #97 | Exceptional $49,658 |
| Immigrants | Northern Africa | 98.9 /100 | #98 | Exceptional $49,648 |
| Immigrants | Afghanistan | 98.9 /100 | #99 | Exceptional $49,645 |