Immigrants from Peru vs Apache Median Earnings
COMPARE
Immigrants from Peru
Apache
Median Earnings
Median Earnings Comparison
Immigrants from Peru
Apache
$47,025
MEDIAN EARNINGS
69.6/ 100
METRIC RATING
159th/ 347
METRIC RANK
$40,388
MEDIAN EARNINGS
0.0/ 100
METRIC RATING
310th/ 347
METRIC RANK
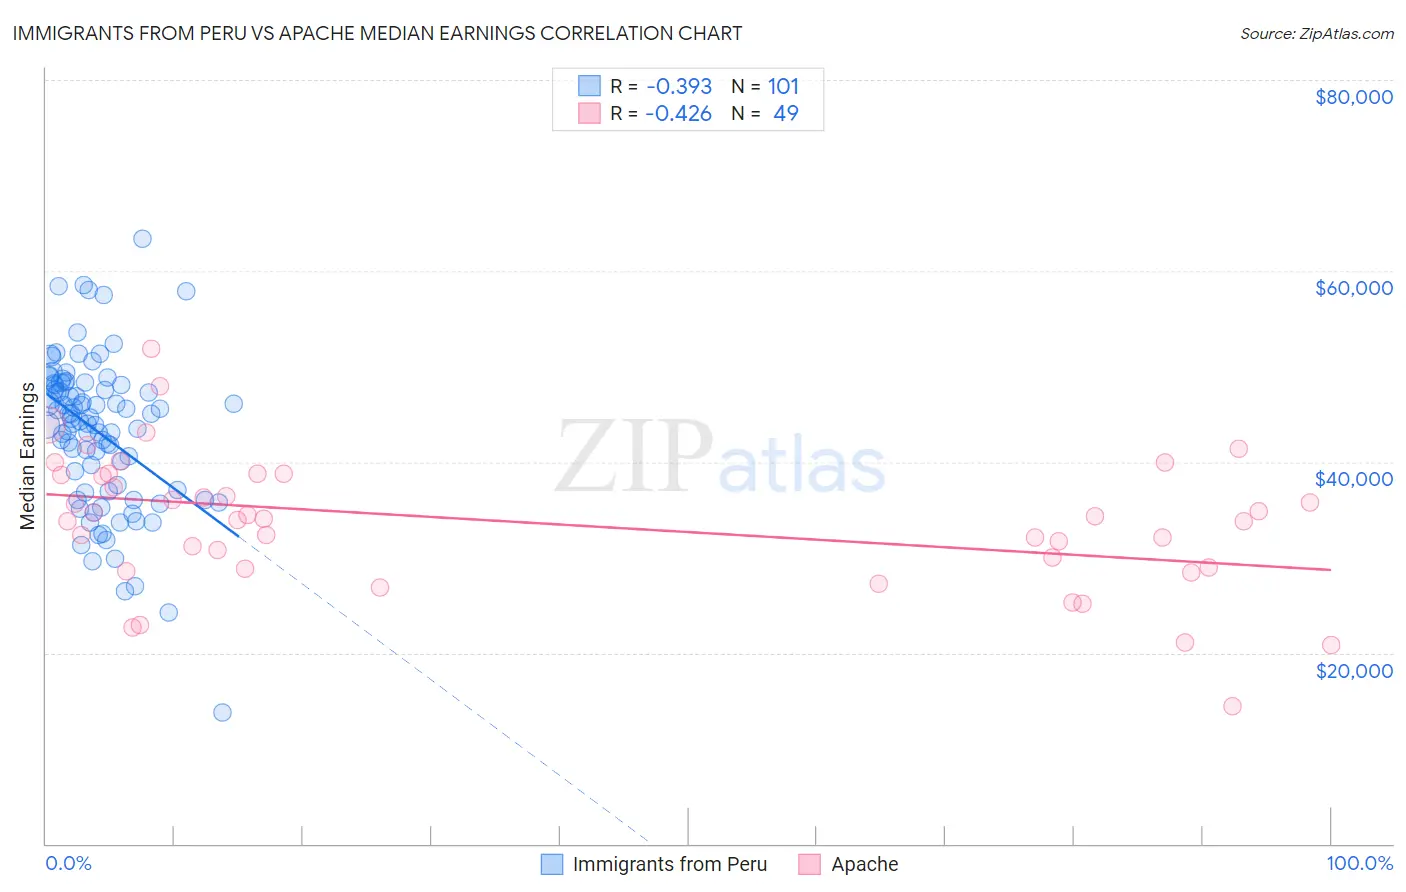
Immigrants from Peru vs Apache Median Earnings Correlation Chart
The statistical analysis conducted on geographies consisting of 328,851,248 people shows a mild negative correlation between the proportion of Immigrants from Peru and median earnings in the United States with a correlation coefficient (R) of -0.393 and weighted average of $47,025. Similarly, the statistical analysis conducted on geographies consisting of 231,119,863 people shows a moderate negative correlation between the proportion of Apache and median earnings in the United States with a correlation coefficient (R) of -0.426 and weighted average of $40,388, a difference of 16.4%.
Median Earnings Correlation Summary
| Measurement | Immigrants from Peru | Apache |
| Minimum | $13,750 | $14,458 |
| Maximum | $63,387 | $51,892 |
| Range | $49,637 | $37,433 |
| Mean | $43,144 | $33,634 |
| Median | $44,577 | $34,056 |
| Interquartile 25% (IQ1) | $36,980 | $28,886 |
| Interquartile 75% (IQ3) | $48,145 | $38,705 |
| Interquartile Range (IQR) | $11,165 | $9,819 |
| Standard Deviation (Sample) | $8,031 | $7,141 |
| Standard Deviation (Population) | $7,991 | $7,068 |
Similar Demographics by Median Earnings
Demographics Similar to Immigrants from Peru by Median Earnings
In terms of median earnings, the demographic groups most similar to Immigrants from Peru are Alsatian ($47,023, a difference of 0.0%), Immigrants from Eastern Africa ($46,969, a difference of 0.12%), Slovak ($47,095, a difference of 0.15%), South American Indian ($46,952, a difference of 0.16%), and Icelander ($46,916, a difference of 0.23%).
| Demographics | Rating | Rank | Median Earnings |
| Immigrants | Germany | 83.1 /100 | #152 | Excellent $47,566 |
| Slavs | 81.1 /100 | #153 | Excellent $47,470 |
| Immigrants | Portugal | 77.3 /100 | #154 | Good $47,304 |
| Immigrants | Vietnam | 76.7 /100 | #155 | Good $47,282 |
| Irish | 76.6 /100 | #156 | Good $47,276 |
| Czechs | 75.1 /100 | #157 | Good $47,221 |
| Slovaks | 71.7 /100 | #158 | Good $47,095 |
| Immigrants | Peru | 69.6 /100 | #159 | Good $47,025 |
| Alsatians | 69.6 /100 | #160 | Good $47,023 |
| Immigrants | Eastern Africa | 68.0 /100 | #161 | Good $46,969 |
| South American Indians | 67.4 /100 | #162 | Good $46,952 |
| Icelanders | 66.3 /100 | #163 | Good $46,916 |
| Norwegians | 64.7 /100 | #164 | Good $46,865 |
| South Americans | 62.7 /100 | #165 | Good $46,804 |
| Czechoslovakians | 57.8 /100 | #166 | Average $46,658 |
Demographics Similar to Apache by Median Earnings
In terms of median earnings, the demographic groups most similar to Apache are Hispanic or Latino ($40,288, a difference of 0.25%), Chippewa ($40,287, a difference of 0.25%), Choctaw ($40,270, a difference of 0.29%), Cheyenne ($40,233, a difference of 0.39%), and Seminole ($40,233, a difference of 0.39%).
| Demographics | Rating | Rank | Median Earnings |
| Haitians | 0.0 /100 | #303 | Tragic $40,918 |
| Immigrants | Guatemala | 0.0 /100 | #304 | Tragic $40,851 |
| Chickasaw | 0.0 /100 | #305 | Tragic $40,672 |
| Yaqui | 0.0 /100 | #306 | Tragic $40,647 |
| Hondurans | 0.0 /100 | #307 | Tragic $40,638 |
| Cubans | 0.0 /100 | #308 | Tragic $40,619 |
| Immigrants | Haiti | 0.0 /100 | #309 | Tragic $40,550 |
| Apache | 0.0 /100 | #310 | Tragic $40,388 |
| Hispanics or Latinos | 0.0 /100 | #311 | Tragic $40,288 |
| Chippewa | 0.0 /100 | #312 | Tragic $40,287 |
| Choctaw | 0.0 /100 | #313 | Tragic $40,270 |
| Cheyenne | 0.0 /100 | #314 | Tragic $40,233 |
| Seminole | 0.0 /100 | #315 | Tragic $40,233 |
| Immigrants | Honduras | 0.0 /100 | #316 | Tragic $40,195 |
| Fijians | 0.0 /100 | #317 | Tragic $40,193 |