Immigrants from Bangladesh vs Apache Median Earnings
COMPARE
Immigrants from Bangladesh
Apache
Median Earnings
Median Earnings Comparison
Immigrants from Bangladesh
Apache
$45,532
MEDIAN EARNINGS
22.0/ 100
METRIC RATING
215th/ 347
METRIC RANK
$40,388
MEDIAN EARNINGS
0.0/ 100
METRIC RATING
310th/ 347
METRIC RANK
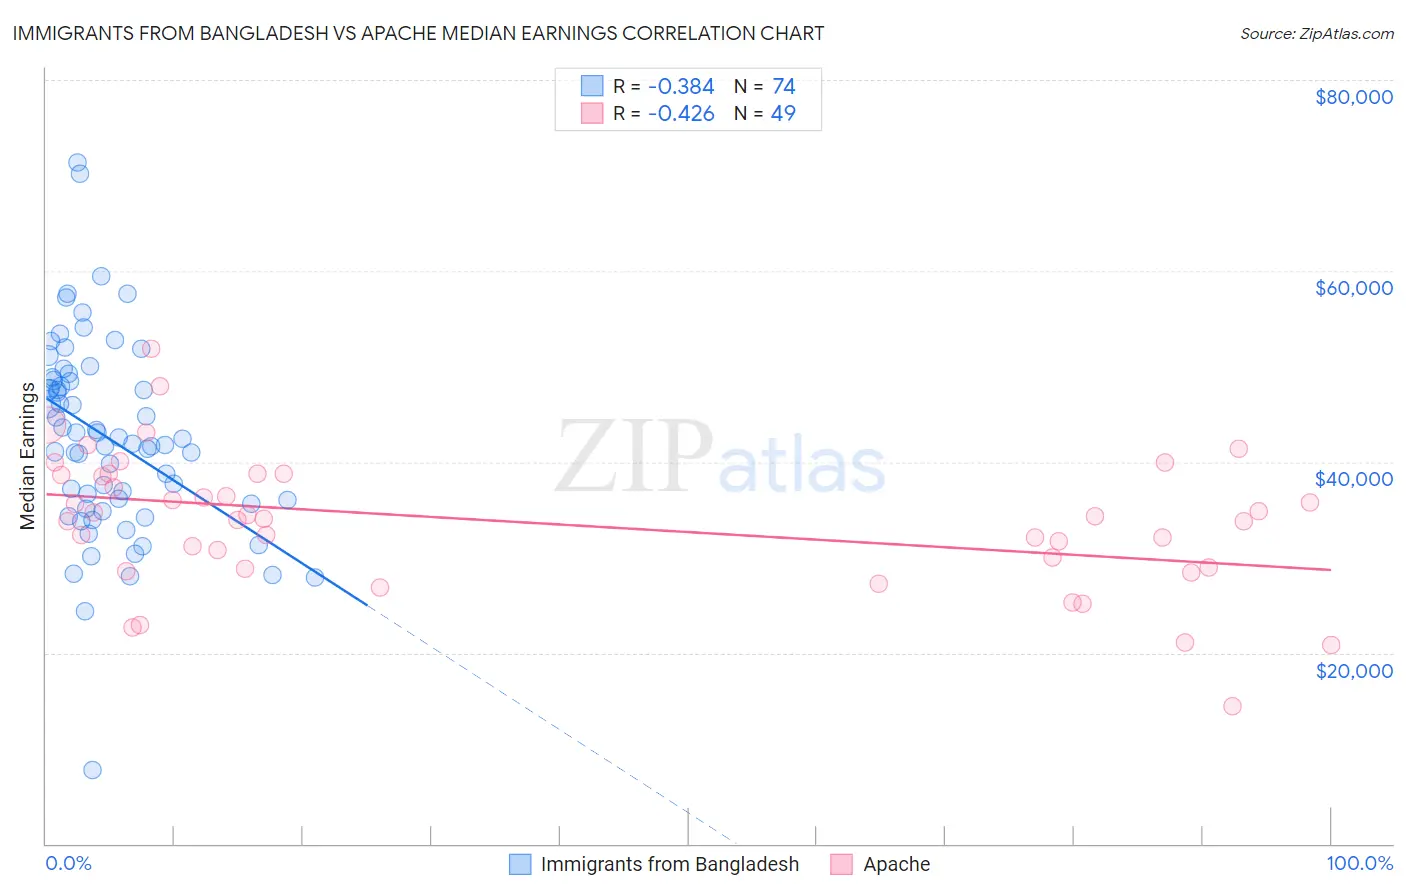
Immigrants from Bangladesh vs Apache Median Earnings Correlation Chart
The statistical analysis conducted on geographies consisting of 203,670,623 people shows a mild negative correlation between the proportion of Immigrants from Bangladesh and median earnings in the United States with a correlation coefficient (R) of -0.384 and weighted average of $45,532. Similarly, the statistical analysis conducted on geographies consisting of 231,119,863 people shows a moderate negative correlation between the proportion of Apache and median earnings in the United States with a correlation coefficient (R) of -0.426 and weighted average of $40,388, a difference of 12.7%.
Median Earnings Correlation Summary
| Measurement | Immigrants from Bangladesh | Apache |
| Minimum | $7,703 | $14,458 |
| Maximum | $71,366 | $51,892 |
| Range | $63,663 | $37,433 |
| Mean | $42,517 | $33,634 |
| Median | $42,193 | $34,056 |
| Interquartile 25% (IQ1) | $35,657 | $28,886 |
| Interquartile 75% (IQ3) | $48,515 | $38,705 |
| Interquartile Range (IQR) | $12,858 | $9,819 |
| Standard Deviation (Sample) | $10,295 | $7,141 |
| Standard Deviation (Population) | $10,225 | $7,068 |
Similar Demographics by Median Earnings
Demographics Similar to Immigrants from Bangladesh by Median Earnings
In terms of median earnings, the demographic groups most similar to Immigrants from Bangladesh are Nigerian ($45,532, a difference of 0.0%), Immigrants from Colombia ($45,550, a difference of 0.040%), Panamanian ($45,593, a difference of 0.13%), Bermudan ($45,593, a difference of 0.13%), and Immigrants from Grenada ($45,596, a difference of 0.14%).
| Demographics | Rating | Rank | Median Earnings |
| Immigrants | Bosnia and Herzegovina | 23.7 /100 | #208 | Fair $45,600 |
| Immigrants | Thailand | 23.7 /100 | #209 | Fair $45,598 |
| Immigrants | Grenada | 23.6 /100 | #210 | Fair $45,596 |
| Panamanians | 23.5 /100 | #211 | Fair $45,593 |
| Bermudans | 23.5 /100 | #212 | Fair $45,593 |
| Immigrants | Colombia | 22.4 /100 | #213 | Fair $45,550 |
| Nigerians | 22.0 /100 | #214 | Fair $45,532 |
| Immigrants | Bangladesh | 22.0 /100 | #215 | Fair $45,532 |
| Guyanese | 20.6 /100 | #216 | Fair $45,470 |
| Tlingit-Haida | 20.5 /100 | #217 | Fair $45,468 |
| Spanish | 19.7 /100 | #218 | Poor $45,432 |
| Dutch | 18.4 /100 | #219 | Poor $45,370 |
| Ecuadorians | 15.3 /100 | #220 | Poor $45,214 |
| Immigrants | Guyana | 15.1 /100 | #221 | Poor $45,204 |
| Immigrants | Panama | 15.0 /100 | #222 | Poor $45,198 |
Demographics Similar to Apache by Median Earnings
In terms of median earnings, the demographic groups most similar to Apache are Hispanic or Latino ($40,288, a difference of 0.25%), Chippewa ($40,287, a difference of 0.25%), Choctaw ($40,270, a difference of 0.29%), Cheyenne ($40,233, a difference of 0.39%), and Seminole ($40,233, a difference of 0.39%).
| Demographics | Rating | Rank | Median Earnings |
| Haitians | 0.0 /100 | #303 | Tragic $40,918 |
| Immigrants | Guatemala | 0.0 /100 | #304 | Tragic $40,851 |
| Chickasaw | 0.0 /100 | #305 | Tragic $40,672 |
| Yaqui | 0.0 /100 | #306 | Tragic $40,647 |
| Hondurans | 0.0 /100 | #307 | Tragic $40,638 |
| Cubans | 0.0 /100 | #308 | Tragic $40,619 |
| Immigrants | Haiti | 0.0 /100 | #309 | Tragic $40,550 |
| Apache | 0.0 /100 | #310 | Tragic $40,388 |
| Hispanics or Latinos | 0.0 /100 | #311 | Tragic $40,288 |
| Chippewa | 0.0 /100 | #312 | Tragic $40,287 |
| Choctaw | 0.0 /100 | #313 | Tragic $40,270 |
| Cheyenne | 0.0 /100 | #314 | Tragic $40,233 |
| Seminole | 0.0 /100 | #315 | Tragic $40,233 |
| Immigrants | Honduras | 0.0 /100 | #316 | Tragic $40,195 |
| Fijians | 0.0 /100 | #317 | Tragic $40,193 |