Immigrants from Armenia vs Apache Median Earnings
COMPARE
Immigrants from Armenia
Apache
Median Earnings
Median Earnings Comparison
Immigrants from Armenia
Apache
$46,094
MEDIAN EARNINGS
38.3/ 100
METRIC RATING
188th/ 347
METRIC RANK
$40,388
MEDIAN EARNINGS
0.0/ 100
METRIC RATING
310th/ 347
METRIC RANK
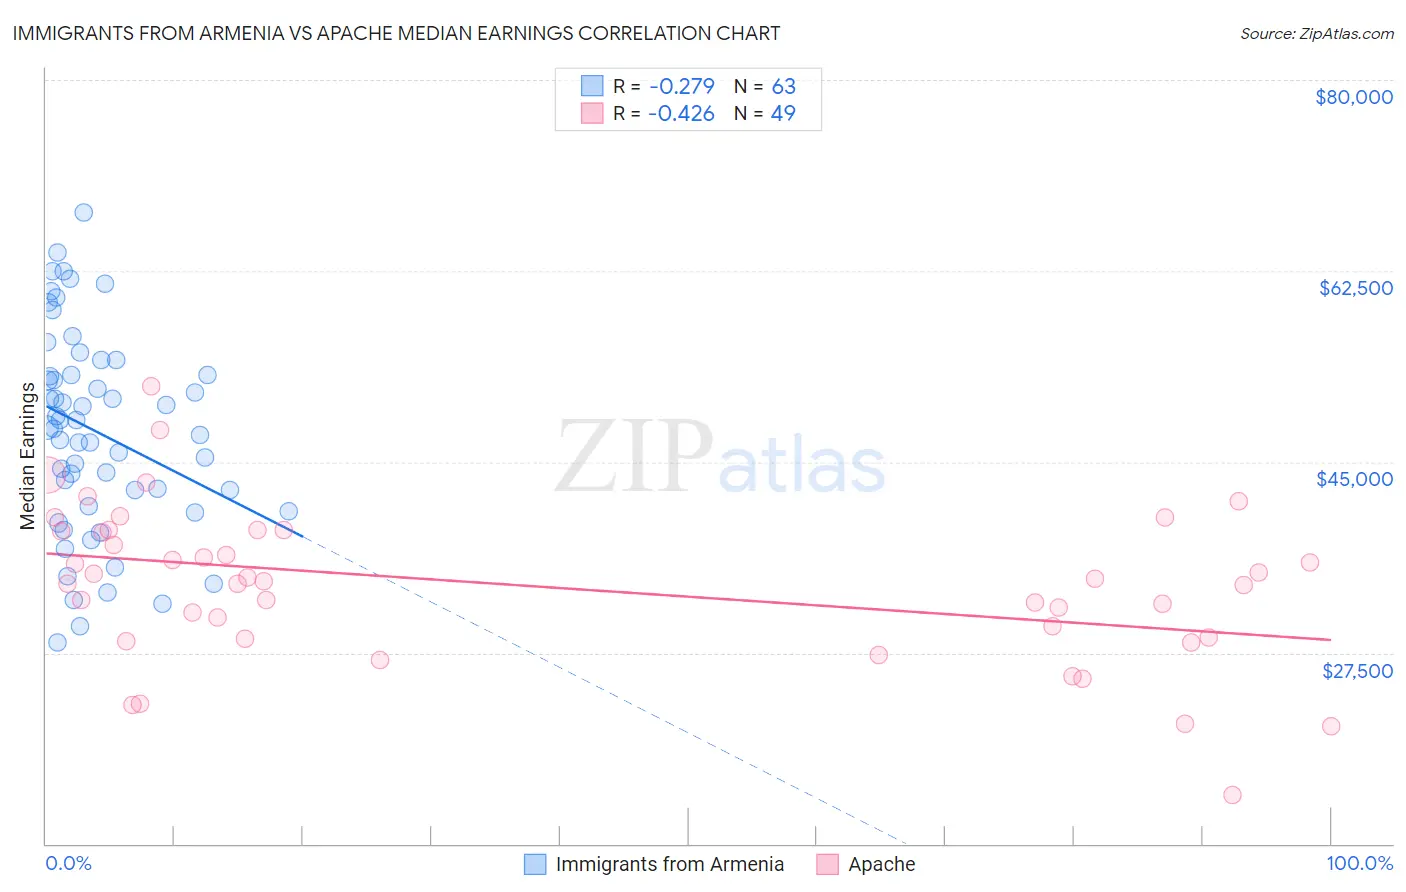
Immigrants from Armenia vs Apache Median Earnings Correlation Chart
The statistical analysis conducted on geographies consisting of 97,724,966 people shows a weak negative correlation between the proportion of Immigrants from Armenia and median earnings in the United States with a correlation coefficient (R) of -0.279 and weighted average of $46,094. Similarly, the statistical analysis conducted on geographies consisting of 231,119,863 people shows a moderate negative correlation between the proportion of Apache and median earnings in the United States with a correlation coefficient (R) of -0.426 and weighted average of $40,388, a difference of 14.1%.
Median Earnings Correlation Summary
| Measurement | Immigrants from Armenia | Apache |
| Minimum | $28,479 | $14,458 |
| Maximum | $67,833 | $51,892 |
| Range | $39,354 | $37,433 |
| Mean | $47,758 | $33,634 |
| Median | $48,131 | $34,056 |
| Interquartile 25% (IQ1) | $40,972 | $28,886 |
| Interquartile 75% (IQ3) | $53,018 | $38,705 |
| Interquartile Range (IQR) | $12,046 | $9,819 |
| Standard Deviation (Sample) | $9,191 | $7,141 |
| Standard Deviation (Population) | $9,118 | $7,068 |
Similar Demographics by Median Earnings
Demographics Similar to Immigrants from Armenia by Median Earnings
In terms of median earnings, the demographic groups most similar to Immigrants from Armenia are Spaniard ($46,059, a difference of 0.080%), Iraqi ($46,140, a difference of 0.10%), French Canadian ($46,026, a difference of 0.15%), Vietnamese ($46,172, a difference of 0.17%), and Uruguayan ($46,190, a difference of 0.21%).
| Demographics | Rating | Rank | Median Earnings |
| Immigrants | Cameroon | 46.4 /100 | #181 | Average $46,329 |
| Swiss | 45.9 /100 | #182 | Average $46,315 |
| French | 45.2 /100 | #183 | Average $46,296 |
| Immigrants | Kenya | 42.4 /100 | #184 | Average $46,214 |
| Uruguayans | 41.6 /100 | #185 | Average $46,190 |
| Vietnamese | 40.9 /100 | #186 | Average $46,172 |
| Iraqis | 39.9 /100 | #187 | Fair $46,140 |
| Immigrants | Armenia | 38.3 /100 | #188 | Fair $46,094 |
| Spaniards | 37.2 /100 | #189 | Fair $46,059 |
| French Canadians | 36.1 /100 | #190 | Fair $46,026 |
| Finns | 33.4 /100 | #191 | Fair $45,940 |
| Germans | 33.2 /100 | #192 | Fair $45,935 |
| Guamanians/Chamorros | 33.2 /100 | #193 | Fair $45,933 |
| Immigrants | Costa Rica | 33.0 /100 | #194 | Fair $45,928 |
| Immigrants | St. Vincent and the Grenadines | 32.4 /100 | #195 | Fair $45,908 |
Demographics Similar to Apache by Median Earnings
In terms of median earnings, the demographic groups most similar to Apache are Hispanic or Latino ($40,288, a difference of 0.25%), Chippewa ($40,287, a difference of 0.25%), Choctaw ($40,270, a difference of 0.29%), Cheyenne ($40,233, a difference of 0.39%), and Seminole ($40,233, a difference of 0.39%).
| Demographics | Rating | Rank | Median Earnings |
| Haitians | 0.0 /100 | #303 | Tragic $40,918 |
| Immigrants | Guatemala | 0.0 /100 | #304 | Tragic $40,851 |
| Chickasaw | 0.0 /100 | #305 | Tragic $40,672 |
| Yaqui | 0.0 /100 | #306 | Tragic $40,647 |
| Hondurans | 0.0 /100 | #307 | Tragic $40,638 |
| Cubans | 0.0 /100 | #308 | Tragic $40,619 |
| Immigrants | Haiti | 0.0 /100 | #309 | Tragic $40,550 |
| Apache | 0.0 /100 | #310 | Tragic $40,388 |
| Hispanics or Latinos | 0.0 /100 | #311 | Tragic $40,288 |
| Chippewa | 0.0 /100 | #312 | Tragic $40,287 |
| Choctaw | 0.0 /100 | #313 | Tragic $40,270 |
| Cheyenne | 0.0 /100 | #314 | Tragic $40,233 |
| Seminole | 0.0 /100 | #315 | Tragic $40,233 |
| Immigrants | Honduras | 0.0 /100 | #316 | Tragic $40,195 |
| Fijians | 0.0 /100 | #317 | Tragic $40,193 |