Syrian vs Immigrants from Grenada 1 or more Vehicles in Household
COMPARE
Syrian
Immigrants from Grenada
1 or more Vehicles in Household
1 or more Vehicles in Household Comparison
Syrians
Immigrants from Grenada
90.3%
1 OR MORE VEHICLES IN HOUSEHOLD
86.3/ 100
METRIC RATING
138th/ 347
METRIC RANK
62.7%
1 OR MORE VEHICLES IN HOUSEHOLD
0.0/ 100
METRIC RATING
346th/ 347
METRIC RANK
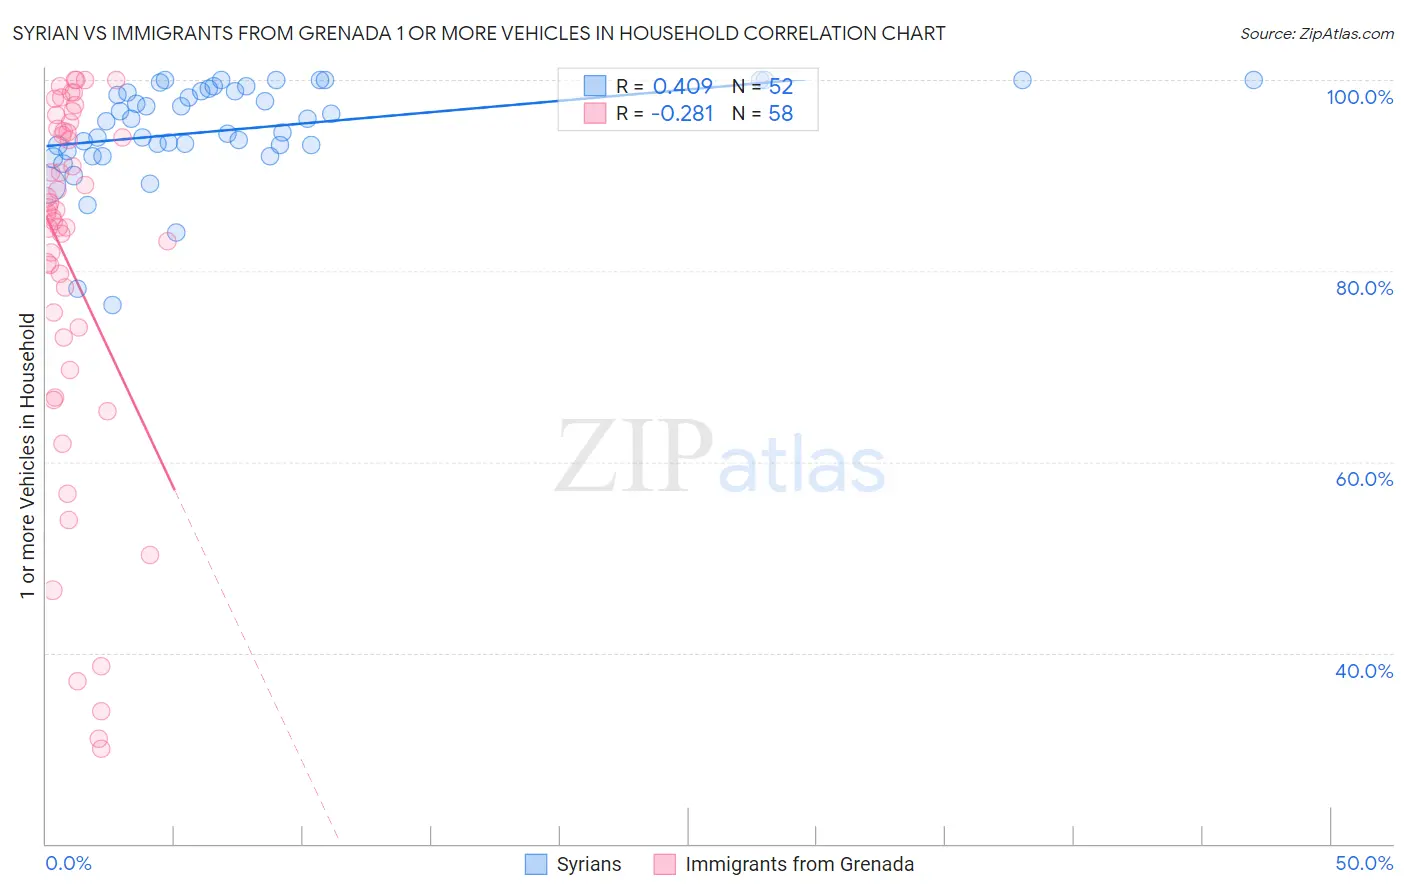
Syrian vs Immigrants from Grenada 1 or more Vehicles in Household Correlation Chart
The statistical analysis conducted on geographies consisting of 266,214,242 people shows a moderate positive correlation between the proportion of Syrians and percentage of households with 1 or more vehicles available in the United States with a correlation coefficient (R) of 0.409 and weighted average of 90.3%. Similarly, the statistical analysis conducted on geographies consisting of 67,200,374 people shows a weak negative correlation between the proportion of Immigrants from Grenada and percentage of households with 1 or more vehicles available in the United States with a correlation coefficient (R) of -0.281 and weighted average of 62.7%, a difference of 44.1%.
1 or more Vehicles in Household Correlation Summary
| Measurement | Syrian | Immigrants from Grenada |
| Minimum | 76.4% | 30.0% |
| Maximum | 100.0% | 100.0% |
| Range | 23.6% | 70.0% |
| Mean | 94.8% | 80.2% |
| Median | 95.8% | 85.9% |
| Interquartile 25% (IQ1) | 92.9% | 73.0% |
| Interquartile 75% (IQ3) | 99.0% | 94.7% |
| Interquartile Range (IQR) | 6.1% | 21.6% |
| Standard Deviation (Sample) | 5.2% | 19.4% |
| Standard Deviation (Population) | 5.2% | 19.2% |
Similar Demographics by 1 or more Vehicles in Household
Demographics Similar to Syrians by 1 or more Vehicles in Household
In terms of 1 or more vehicles in household, the demographic groups most similar to Syrians are Latvian (90.3%, a difference of 0.0%), Hungarian (90.3%, a difference of 0.010%), Kenyan (90.4%, a difference of 0.020%), Immigrants from Oceania (90.4%, a difference of 0.020%), and Estonian (90.3%, a difference of 0.020%).
| Demographics | Rating | Rank | 1 or more Vehicles in Household |
| Immigrants | Kenya | 88.5 /100 | #131 | Excellent 90.4% |
| Immigrants | South Africa | 88.1 /100 | #132 | Excellent 90.4% |
| Immigrants | Syria | 87.5 /100 | #133 | Excellent 90.4% |
| Kenyans | 87.0 /100 | #134 | Excellent 90.4% |
| Immigrants | Oceania | 86.9 /100 | #135 | Excellent 90.4% |
| Hungarians | 86.5 /100 | #136 | Excellent 90.3% |
| Latvians | 86.3 /100 | #137 | Excellent 90.3% |
| Syrians | 86.3 /100 | #138 | Excellent 90.3% |
| Estonians | 85.6 /100 | #139 | Excellent 90.3% |
| Sudanese | 85.2 /100 | #140 | Excellent 90.3% |
| Immigrants | Moldova | 83.1 /100 | #141 | Excellent 90.2% |
| Immigrants | Lithuania | 83.0 /100 | #142 | Excellent 90.2% |
| Immigrants | Bahamas | 81.5 /100 | #143 | Excellent 90.2% |
| Immigrants | Zimbabwe | 81.5 /100 | #144 | Excellent 90.2% |
| Sioux | 81.3 /100 | #145 | Excellent 90.2% |
Demographics Similar to Immigrants from Grenada by 1 or more Vehicles in Household
In terms of 1 or more vehicles in household, the demographic groups most similar to Immigrants from Grenada are Immigrants from St. Vincent and the Grenadines (64.7%, a difference of 3.2%), Yup'ik (58.4%, a difference of 7.2%), Immigrants from Dominican Republic (68.6%, a difference of 9.5%), British West Indian (70.4%, a difference of 12.2%), and Immigrants from Guyana (70.6%, a difference of 12.6%).
| Demographics | Rating | Rank | 1 or more Vehicles in Household |
| Immigrants | Ecuador | 0.0 /100 | #333 | Tragic 76.2% |
| Immigrants | Bangladesh | 0.0 /100 | #334 | Tragic 74.3% |
| Barbadians | 0.0 /100 | #335 | Tragic 74.0% |
| Vietnamese | 0.0 /100 | #336 | Tragic 73.8% |
| Immigrants | Uzbekistan | 0.0 /100 | #337 | Tragic 73.4% |
| Inupiat | 0.0 /100 | #338 | Tragic 71.5% |
| Guyanese | 0.0 /100 | #339 | Tragic 70.8% |
| Dominicans | 0.0 /100 | #340 | Tragic 70.7% |
| Immigrants | Barbados | 0.0 /100 | #341 | Tragic 70.6% |
| Immigrants | Guyana | 0.0 /100 | #342 | Tragic 70.6% |
| British West Indians | 0.0 /100 | #343 | Tragic 70.4% |
| Immigrants | Dominican Republic | 0.0 /100 | #344 | Tragic 68.6% |
| Immigrants | St. Vincent and the Grenadines | 0.0 /100 | #345 | Tragic 64.7% |
| Immigrants | Grenada | 0.0 /100 | #346 | Tragic 62.7% |
| Yup'ik | 0.0 /100 | #347 | Tragic 58.4% |