Syrian vs Immigrants from Grenada 9th Grade
COMPARE
Syrian
Immigrants from Grenada
9th Grade
9th Grade Comparison
Syrians
Immigrants from Grenada
95.5%
9TH GRADE
97.4/ 100
METRIC RATING
104th/ 347
METRIC RANK
93.0%
9TH GRADE
0.0/ 100
METRIC RATING
299th/ 347
METRIC RANK
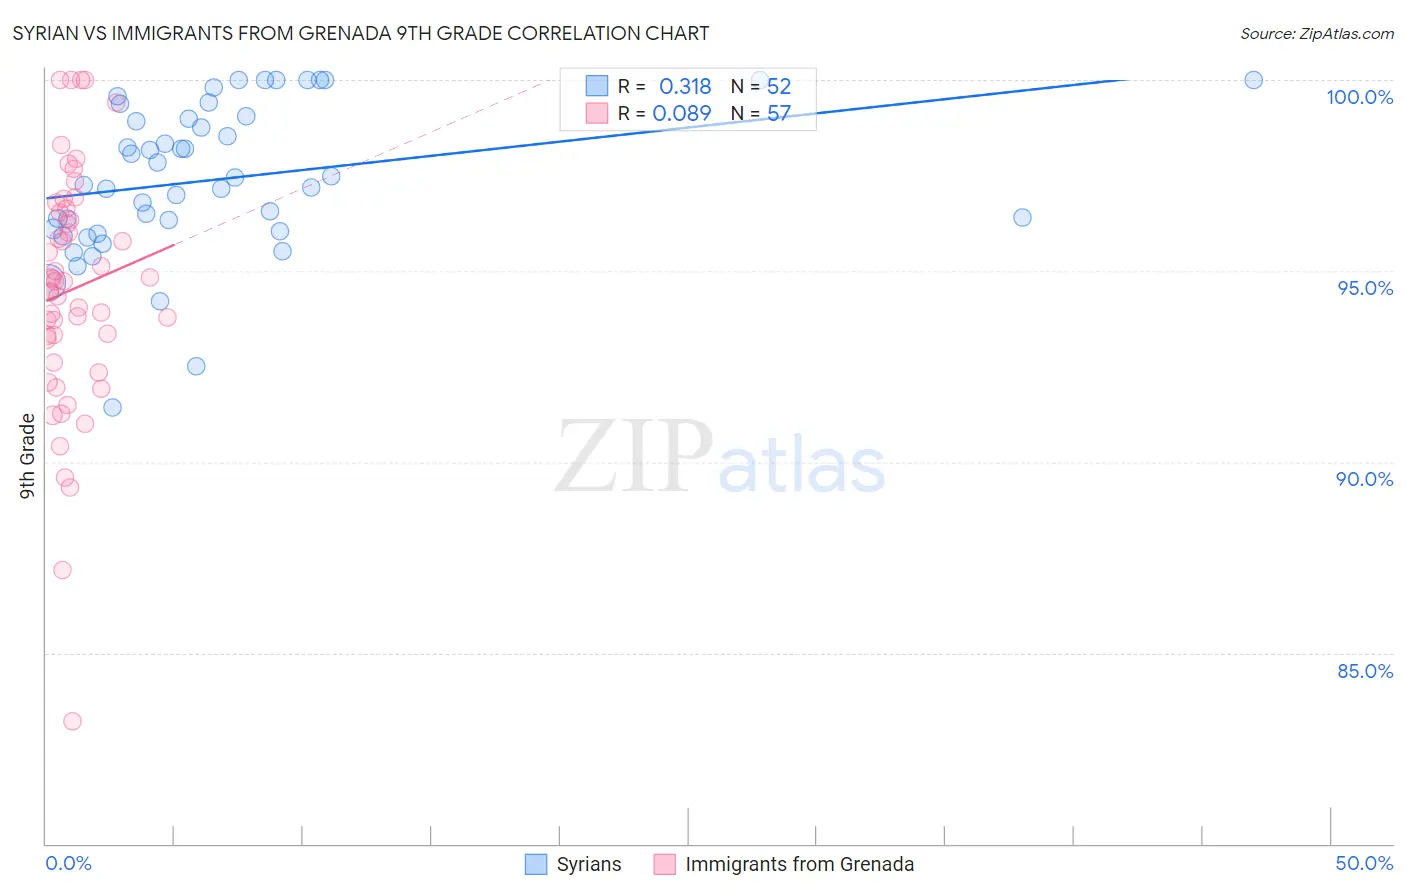
Syrian vs Immigrants from Grenada 9th Grade Correlation Chart
The statistical analysis conducted on geographies consisting of 266,305,988 people shows a mild positive correlation between the proportion of Syrians and percentage of population with at least 9th grade education in the United States with a correlation coefficient (R) of 0.318 and weighted average of 95.5%. Similarly, the statistical analysis conducted on geographies consisting of 67,193,627 people shows a slight positive correlation between the proportion of Immigrants from Grenada and percentage of population with at least 9th grade education in the United States with a correlation coefficient (R) of 0.089 and weighted average of 93.0%, a difference of 2.7%.
9th Grade Correlation Summary
| Measurement | Syrian | Immigrants from Grenada |
| Minimum | 91.4% | 83.2% |
| Maximum | 100.0% | 100.0% |
| Range | 8.6% | 16.8% |
| Mean | 97.4% | 94.5% |
| Median | 97.3% | 94.7% |
| Interquartile 25% (IQ1) | 96.1% | 92.9% |
| Interquartile 75% (IQ3) | 99.0% | 96.6% |
| Interquartile Range (IQR) | 2.9% | 3.7% |
| Standard Deviation (Sample) | 2.0% | 3.2% |
| Standard Deviation (Population) | 2.0% | 3.2% |
Similar Demographics by 9th Grade
Demographics Similar to Syrians by 9th Grade
In terms of 9th grade, the demographic groups most similar to Syrians are Immigrants from France (95.5%, a difference of 0.0%), Potawatomi (95.5%, a difference of 0.020%), Immigrants from Norway (95.5%, a difference of 0.020%), Immigrants from Switzerland (95.5%, a difference of 0.030%), and Immigrants from Zimbabwe (95.5%, a difference of 0.030%).
| Demographics | Rating | Rank | 9th Grade |
| Delaware | 98.4 /100 | #97 | Exceptional 95.6% |
| Immigrants | Japan | 98.4 /100 | #98 | Exceptional 95.6% |
| Menominee | 98.3 /100 | #99 | Exceptional 95.6% |
| Lebanese | 98.1 /100 | #100 | Exceptional 95.6% |
| Immigrants | Moldova | 97.9 /100 | #101 | Exceptional 95.5% |
| Immigrants | Switzerland | 97.7 /100 | #102 | Exceptional 95.5% |
| Potawatomi | 97.7 /100 | #103 | Exceptional 95.5% |
| Syrians | 97.4 /100 | #104 | Exceptional 95.5% |
| Immigrants | France | 97.4 /100 | #105 | Exceptional 95.5% |
| Immigrants | Norway | 97.1 /100 | #106 | Exceptional 95.5% |
| Immigrants | Zimbabwe | 96.9 /100 | #107 | Exceptional 95.5% |
| Chickasaw | 96.8 /100 | #108 | Exceptional 95.5% |
| Osage | 96.8 /100 | #109 | Exceptional 95.5% |
| Immigrants | Bulgaria | 96.7 /100 | #110 | Exceptional 95.5% |
| Cherokee | 96.3 /100 | #111 | Exceptional 95.4% |
Demographics Similar to Immigrants from Grenada by 9th Grade
In terms of 9th grade, the demographic groups most similar to Immigrants from Grenada are Haitian (93.1%, a difference of 0.060%), Fijian (93.1%, a difference of 0.090%), Immigrants from Burma/Myanmar (93.1%, a difference of 0.12%), Indonesian (93.1%, a difference of 0.12%), and Yaqui (92.9%, a difference of 0.13%).
| Demographics | Rating | Rank | 9th Grade |
| Immigrants | Laos | 0.0 /100 | #292 | Tragic 93.2% |
| Sri Lankans | 0.0 /100 | #293 | Tragic 93.2% |
| Cubans | 0.0 /100 | #294 | Tragic 93.2% |
| Immigrants | Burma/Myanmar | 0.0 /100 | #295 | Tragic 93.1% |
| Indonesians | 0.0 /100 | #296 | Tragic 93.1% |
| Fijians | 0.0 /100 | #297 | Tragic 93.1% |
| Haitians | 0.0 /100 | #298 | Tragic 93.1% |
| Immigrants | Grenada | 0.0 /100 | #299 | Tragic 93.0% |
| Yaqui | 0.0 /100 | #300 | Tragic 92.9% |
| Immigrants | Haiti | 0.0 /100 | #301 | Tragic 92.7% |
| Immigrants | Dominica | 0.0 /100 | #302 | Tragic 92.7% |
| Guyanese | 0.0 /100 | #303 | Tragic 92.7% |
| Tohono O'odham | 0.0 /100 | #304 | Tragic 92.6% |
| Japanese | 0.0 /100 | #305 | Tragic 92.6% |
| Immigrants | Vietnam | 0.0 /100 | #306 | Tragic 92.6% |