Sudanese vs Latvian In Labor Force | Age 20-24
COMPARE
Sudanese
Latvian
In Labor Force | Age 20-24
In Labor Force | Age 20-24 Comparison
Sudanese
Latvians
78.4%
IN LABOR FORCE | AGE 20-24
100.0/ 100
METRIC RATING
15th/ 347
METRIC RANK
76.1%
IN LABOR FORCE | AGE 20-24
97.6/ 100
METRIC RATING
102nd/ 347
METRIC RANK
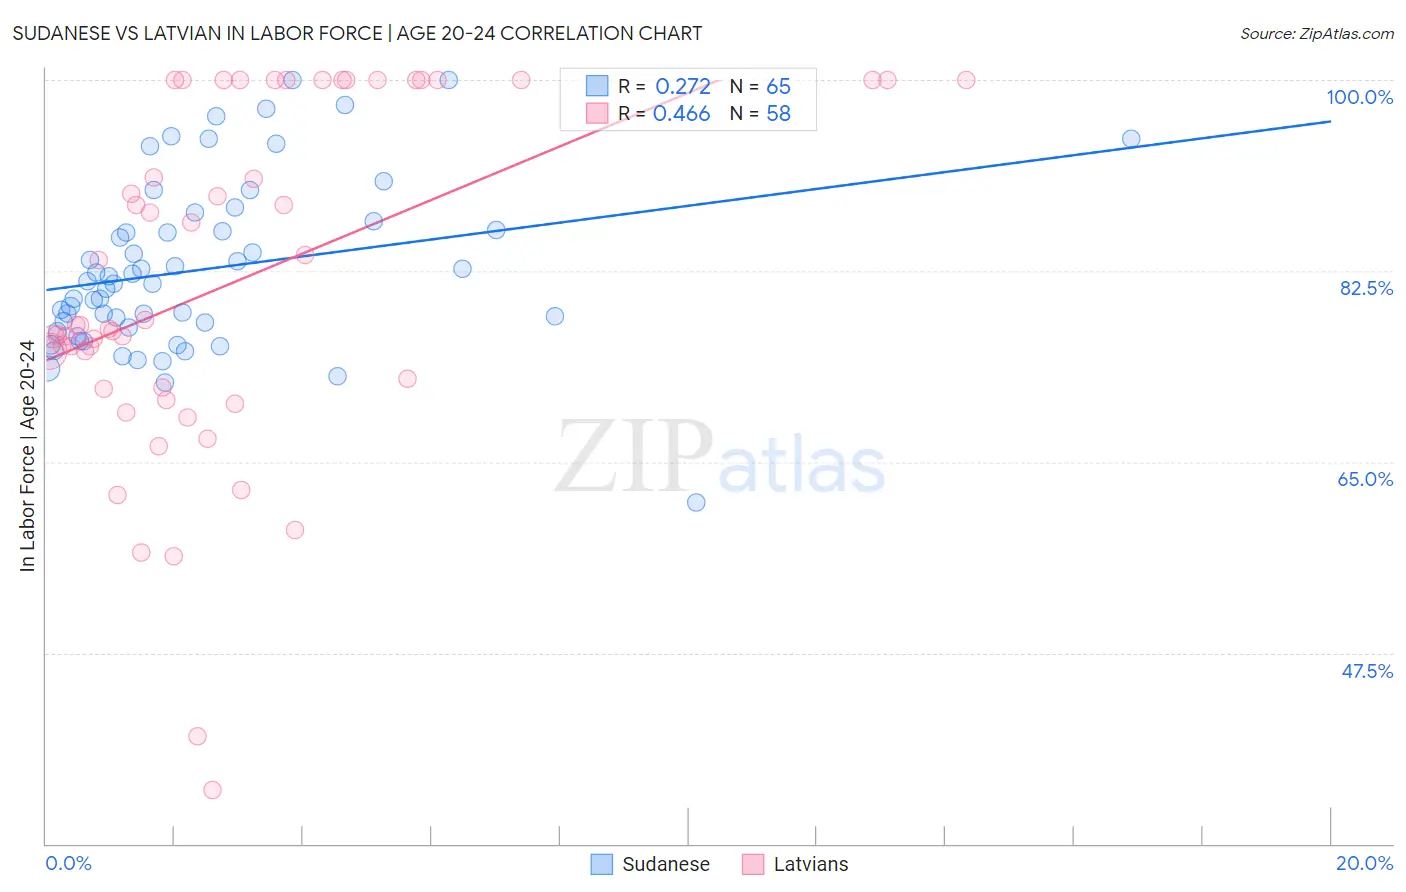
Sudanese vs Latvian In Labor Force | Age 20-24 Correlation Chart
The statistical analysis conducted on geographies consisting of 110,139,890 people shows a weak positive correlation between the proportion of Sudanese and labor force participation rate among population between the ages 20 and 24 in the United States with a correlation coefficient (R) of 0.272 and weighted average of 78.4%. Similarly, the statistical analysis conducted on geographies consisting of 220,651,647 people shows a moderate positive correlation between the proportion of Latvians and labor force participation rate among population between the ages 20 and 24 in the United States with a correlation coefficient (R) of 0.466 and weighted average of 76.1%, a difference of 3.1%.
In Labor Force | Age 20-24 Correlation Summary
| Measurement | Sudanese | Latvian |
| Minimum | 61.3% | 34.9% |
| Maximum | 100.0% | 100.0% |
| Range | 38.7% | 65.1% |
| Mean | 82.6% | 81.5% |
| Median | 81.3% | 77.5% |
| Interquartile 25% (IQ1) | 77.1% | 71.8% |
| Interquartile 75% (IQ3) | 86.7% | 100.0% |
| Interquartile Range (IQR) | 9.5% | 28.2% |
| Standard Deviation (Sample) | 7.7% | 15.9% |
| Standard Deviation (Population) | 7.7% | 15.7% |
Similar Demographics by In Labor Force | Age 20-24
Demographics Similar to Sudanese by In Labor Force | Age 20-24
In terms of in labor force | age 20-24, the demographic groups most similar to Sudanese are Dutch (78.4%, a difference of 0.050%), Cape Verdean (78.3%, a difference of 0.090%), Czech (78.5%, a difference of 0.13%), Scandinavian (78.5%, a difference of 0.14%), and German (78.6%, a difference of 0.21%).
| Demographics | Rating | Rank | In Labor Force | Age 20-24 |
| Immigrants | Cabo Verde | 100.0 /100 | #8 | Exceptional 78.9% |
| Swedes | 100.0 /100 | #9 | Exceptional 78.8% |
| Slovenes | 100.0 /100 | #10 | Exceptional 78.7% |
| Finns | 100.0 /100 | #11 | Exceptional 78.7% |
| Germans | 100.0 /100 | #12 | Exceptional 78.6% |
| Scandinavians | 100.0 /100 | #13 | Exceptional 78.5% |
| Czechs | 100.0 /100 | #14 | Exceptional 78.5% |
| Sudanese | 100.0 /100 | #15 | Exceptional 78.4% |
| Dutch | 100.0 /100 | #16 | Exceptional 78.4% |
| Cape Verdeans | 100.0 /100 | #17 | Exceptional 78.3% |
| Immigrants | Bosnia and Herzegovina | 100.0 /100 | #18 | Exceptional 78.1% |
| Bangladeshis | 100.0 /100 | #19 | Exceptional 78.1% |
| French Canadians | 100.0 /100 | #20 | Exceptional 78.1% |
| Puget Sound Salish | 100.0 /100 | #21 | Exceptional 78.0% |
| Pennsylvania Germans | 100.0 /100 | #22 | Exceptional 78.0% |
Demographics Similar to Latvians by In Labor Force | Age 20-24
In terms of in labor force | age 20-24, the demographic groups most similar to Latvians are Immigrants from Poland (76.1%, a difference of 0.010%), Shoshone (76.1%, a difference of 0.020%), Immigrants from North Macedonia (76.1%, a difference of 0.020%), American (76.1%, a difference of 0.030%), and Immigrants from Lithuania (76.1%, a difference of 0.060%).
| Demographics | Rating | Rank | In Labor Force | Age 20-24 |
| Immigrants | Germany | 98.5 /100 | #95 | Exceptional 76.2% |
| Immigrants | Nonimmigrants | 98.5 /100 | #96 | Exceptional 76.2% |
| Immigrants | Lithuania | 98.0 /100 | #97 | Exceptional 76.1% |
| Immigrants | Oceania | 98.0 /100 | #98 | Exceptional 76.1% |
| Americans | 97.8 /100 | #99 | Exceptional 76.1% |
| Shoshone | 97.8 /100 | #100 | Exceptional 76.1% |
| Immigrants | Poland | 97.7 /100 | #101 | Exceptional 76.1% |
| Latvians | 97.6 /100 | #102 | Exceptional 76.1% |
| Immigrants | North Macedonia | 97.5 /100 | #103 | Exceptional 76.1% |
| Macedonians | 97.2 /100 | #104 | Exceptional 76.0% |
| Immigrants | Nepal | 97.2 /100 | #105 | Exceptional 76.0% |
| Immigrants | Uganda | 97.1 /100 | #106 | Exceptional 76.0% |
| Greeks | 96.9 /100 | #107 | Exceptional 76.0% |
| Iraqis | 96.6 /100 | #108 | Exceptional 76.0% |
| Cherokee | 95.8 /100 | #109 | Exceptional 75.9% |