Immigrants from Nicaragua vs Latvian Median Household Income
COMPARE
Immigrants from Nicaragua
Latvian
Median Household Income
Median Household Income Comparison
Immigrants from Nicaragua
Latvians
$76,784
MEDIAN HOUSEHOLD INCOME
0.5/ 100
METRIC RATING
258th/ 347
METRIC RANK
$97,311
MEDIAN HOUSEHOLD INCOME
100.0/ 100
METRIC RATING
37th/ 347
METRIC RANK
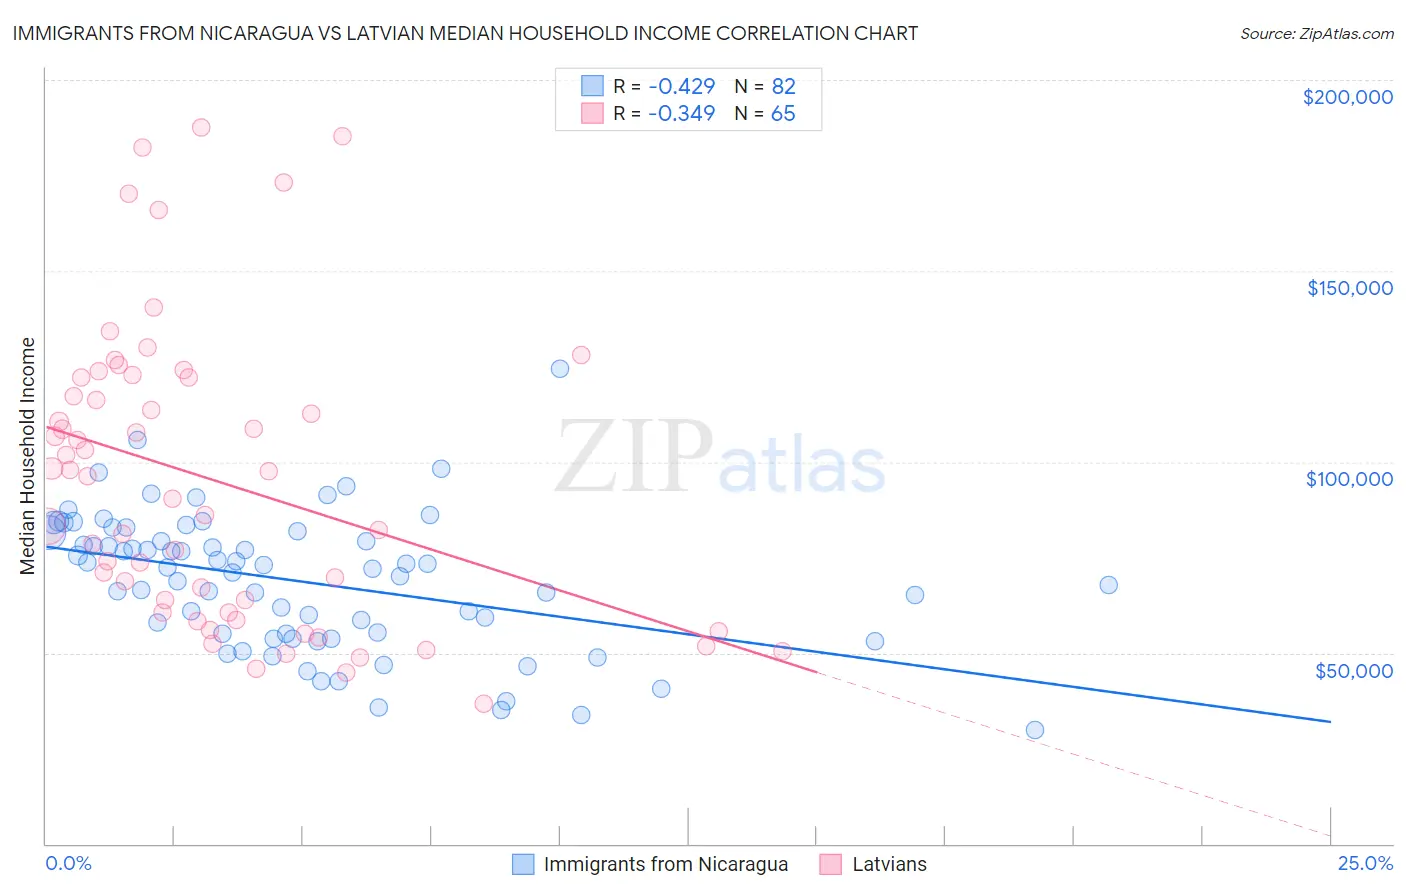
Immigrants from Nicaragua vs Latvian Median Household Income Correlation Chart
The statistical analysis conducted on geographies consisting of 236,313,434 people shows a moderate negative correlation between the proportion of Immigrants from Nicaragua and median household income in the United States with a correlation coefficient (R) of -0.429 and weighted average of $76,784. Similarly, the statistical analysis conducted on geographies consisting of 220,635,560 people shows a mild negative correlation between the proportion of Latvians and median household income in the United States with a correlation coefficient (R) of -0.349 and weighted average of $97,311, a difference of 26.7%.
Median Household Income Correlation Summary
| Measurement | Immigrants from Nicaragua | Latvian |
| Minimum | $29,878 | $36,528 |
| Maximum | $124,491 | $187,593 |
| Range | $94,613 | $151,065 |
| Mean | $68,743 | $95,169 |
| Median | $72,189 | $96,299 |
| Interquartile 25% (IQ1) | $54,917 | $60,583 |
| Interquartile 75% (IQ3) | $81,583 | $122,068 |
| Interquartile Range (IQR) | $26,666 | $61,485 |
| Standard Deviation (Sample) | $17,913 | $38,310 |
| Standard Deviation (Population) | $17,803 | $38,014 |
Similar Demographics by Median Household Income
Demographics Similar to Immigrants from Nicaragua by Median Household Income
In terms of median household income, the demographic groups most similar to Immigrants from Nicaragua are Spanish American Indian ($76,670, a difference of 0.15%), Immigrants from Senegal ($76,915, a difference of 0.17%), Jamaican ($76,583, a difference of 0.26%), Belizean ($77,028, a difference of 0.32%), and Immigrants from Grenada ($76,517, a difference of 0.35%).
| Demographics | Rating | Rank | Median Household Income |
| Mexican American Indians | 1.2 /100 | #251 | Tragic $78,166 |
| Immigrants | West Indies | 1.0 /100 | #252 | Tragic $77,956 |
| Immigrants | St. Vincent and the Grenadines | 0.9 /100 | #253 | Tragic $77,690 |
| Sub-Saharan Africans | 0.8 /100 | #254 | Tragic $77,631 |
| Immigrants | Middle Africa | 0.8 /100 | #255 | Tragic $77,559 |
| Belizeans | 0.6 /100 | #256 | Tragic $77,028 |
| Immigrants | Senegal | 0.5 /100 | #257 | Tragic $76,915 |
| Immigrants | Nicaragua | 0.5 /100 | #258 | Tragic $76,784 |
| Spanish American Indians | 0.4 /100 | #259 | Tragic $76,670 |
| Jamaicans | 0.4 /100 | #260 | Tragic $76,583 |
| Immigrants | Grenada | 0.4 /100 | #261 | Tragic $76,517 |
| French American Indians | 0.4 /100 | #262 | Tragic $76,387 |
| Alaskan Athabascans | 0.4 /100 | #263 | Tragic $76,383 |
| Guatemalans | 0.3 /100 | #264 | Tragic $75,961 |
| Immigrants | Belize | 0.3 /100 | #265 | Tragic $75,938 |
Demographics Similar to Latvians by Median Household Income
In terms of median household income, the demographic groups most similar to Latvians are Immigrants from Indonesia ($97,297, a difference of 0.010%), Immigrants from Pakistan ($97,528, a difference of 0.22%), Afghan ($97,026, a difference of 0.29%), Maltese ($97,015, a difference of 0.31%), and Immigrants from Turkey ($96,964, a difference of 0.36%).
| Demographics | Rating | Rank | Median Household Income |
| Immigrants | Northern Europe | 100.0 /100 | #30 | Exceptional $99,813 |
| Turks | 100.0 /100 | #31 | Exceptional $99,389 |
| Immigrants | Denmark | 100.0 /100 | #32 | Exceptional $98,510 |
| Chinese | 100.0 /100 | #33 | Exceptional $98,496 |
| Russians | 100.0 /100 | #34 | Exceptional $98,008 |
| Immigrants | Switzerland | 100.0 /100 | #35 | Exceptional $97,979 |
| Immigrants | Pakistan | 100.0 /100 | #36 | Exceptional $97,528 |
| Latvians | 100.0 /100 | #37 | Exceptional $97,311 |
| Immigrants | Indonesia | 100.0 /100 | #38 | Exceptional $97,297 |
| Afghans | 100.0 /100 | #39 | Exceptional $97,026 |
| Maltese | 100.0 /100 | #40 | Exceptional $97,015 |
| Immigrants | Turkey | 100.0 /100 | #41 | Exceptional $96,964 |
| Immigrants | Lithuania | 99.9 /100 | #42 | Exceptional $96,836 |
| Immigrants | France | 99.9 /100 | #43 | Exceptional $96,743 |
| Immigrants | Greece | 99.9 /100 | #44 | Exceptional $96,675 |