Spaniard vs Latvian Median Household Income
COMPARE
Spaniard
Latvian
Median Household Income
Median Household Income Comparison
Spaniards
Latvians
$84,644
MEDIAN HOUSEHOLD INCOME
42.7/ 100
METRIC RATING
183rd/ 347
METRIC RANK
$97,311
MEDIAN HOUSEHOLD INCOME
100.0/ 100
METRIC RATING
37th/ 347
METRIC RANK
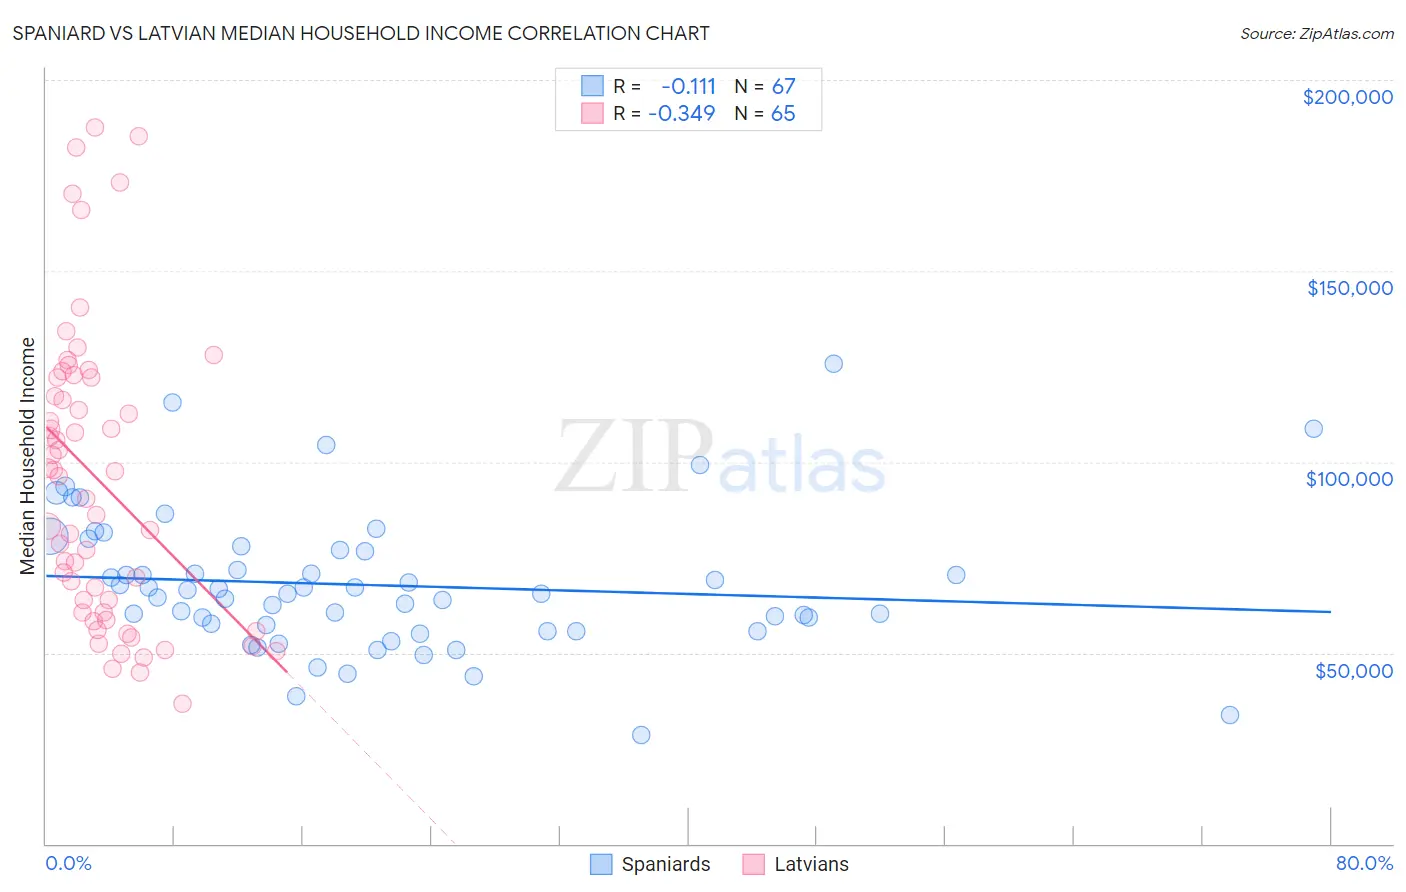
Spaniard vs Latvian Median Household Income Correlation Chart
The statistical analysis conducted on geographies consisting of 443,014,990 people shows a poor negative correlation between the proportion of Spaniards and median household income in the United States with a correlation coefficient (R) of -0.111 and weighted average of $84,644. Similarly, the statistical analysis conducted on geographies consisting of 220,635,560 people shows a mild negative correlation between the proportion of Latvians and median household income in the United States with a correlation coefficient (R) of -0.349 and weighted average of $97,311, a difference of 15.0%.
Median Household Income Correlation Summary
| Measurement | Spaniard | Latvian |
| Minimum | $28,571 | $36,528 |
| Maximum | $125,625 | $187,593 |
| Range | $97,054 | $151,065 |
| Mean | $67,731 | $95,169 |
| Median | $65,475 | $96,299 |
| Interquartile 25% (IQ1) | $55,726 | $60,583 |
| Interquartile 75% (IQ3) | $77,042 | $122,068 |
| Interquartile Range (IQR) | $21,316 | $61,485 |
| Standard Deviation (Sample) | $18,232 | $38,310 |
| Standard Deviation (Population) | $18,096 | $38,014 |
Similar Demographics by Median Household Income
Demographics Similar to Spaniards by Median Household Income
In terms of median household income, the demographic groups most similar to Spaniards are Uruguayan ($84,691, a difference of 0.060%), Hawaiian ($84,729, a difference of 0.10%), Immigrants from Portugal ($84,740, a difference of 0.11%), English ($84,915, a difference of 0.32%), and Czechoslovakian ($84,965, a difference of 0.38%).
| Demographics | Rating | Rank | Median Household Income |
| Alsatians | 49.2 /100 | #176 | Average $85,053 |
| Immigrants | Eritrea | 48.8 /100 | #177 | Average $85,025 |
| Czechoslovakians | 47.8 /100 | #178 | Average $84,965 |
| English | 47.0 /100 | #179 | Average $84,915 |
| Immigrants | Portugal | 44.2 /100 | #180 | Average $84,740 |
| Hawaiians | 44.1 /100 | #181 | Average $84,729 |
| Uruguayans | 43.5 /100 | #182 | Average $84,691 |
| Spaniards | 42.7 /100 | #183 | Average $84,644 |
| Immigrants | Eastern Africa | 37.4 /100 | #184 | Fair $84,299 |
| Kenyans | 34.2 /100 | #185 | Fair $84,085 |
| Puget Sound Salish | 33.2 /100 | #186 | Fair $84,011 |
| Belgians | 33.2 /100 | #187 | Fair $84,008 |
| Tlingit-Haida | 32.6 /100 | #188 | Fair $83,968 |
| Immigrants | Colombia | 31.7 /100 | #189 | Fair $83,902 |
| Slovaks | 30.2 /100 | #190 | Fair $83,798 |
Demographics Similar to Latvians by Median Household Income
In terms of median household income, the demographic groups most similar to Latvians are Immigrants from Indonesia ($97,297, a difference of 0.010%), Immigrants from Pakistan ($97,528, a difference of 0.22%), Afghan ($97,026, a difference of 0.29%), Maltese ($97,015, a difference of 0.31%), and Immigrants from Turkey ($96,964, a difference of 0.36%).
| Demographics | Rating | Rank | Median Household Income |
| Immigrants | Northern Europe | 100.0 /100 | #30 | Exceptional $99,813 |
| Turks | 100.0 /100 | #31 | Exceptional $99,389 |
| Immigrants | Denmark | 100.0 /100 | #32 | Exceptional $98,510 |
| Chinese | 100.0 /100 | #33 | Exceptional $98,496 |
| Russians | 100.0 /100 | #34 | Exceptional $98,008 |
| Immigrants | Switzerland | 100.0 /100 | #35 | Exceptional $97,979 |
| Immigrants | Pakistan | 100.0 /100 | #36 | Exceptional $97,528 |
| Latvians | 100.0 /100 | #37 | Exceptional $97,311 |
| Immigrants | Indonesia | 100.0 /100 | #38 | Exceptional $97,297 |
| Afghans | 100.0 /100 | #39 | Exceptional $97,026 |
| Maltese | 100.0 /100 | #40 | Exceptional $97,015 |
| Immigrants | Turkey | 100.0 /100 | #41 | Exceptional $96,964 |
| Immigrants | Lithuania | 99.9 /100 | #42 | Exceptional $96,836 |
| Immigrants | France | 99.9 /100 | #43 | Exceptional $96,743 |
| Immigrants | Greece | 99.9 /100 | #44 | Exceptional $96,675 |