Sudanese vs Latvian Family Households
COMPARE
Sudanese
Latvian
Family Households
Family Households Comparison
Sudanese
Latvians
60.0%
FAMILY HOUSEHOLDS
0.0/ 100
METRIC RATING
342nd/ 347
METRIC RANK
62.8%
FAMILY HOUSEHOLDS
0.1/ 100
METRIC RATING
287th/ 347
METRIC RANK
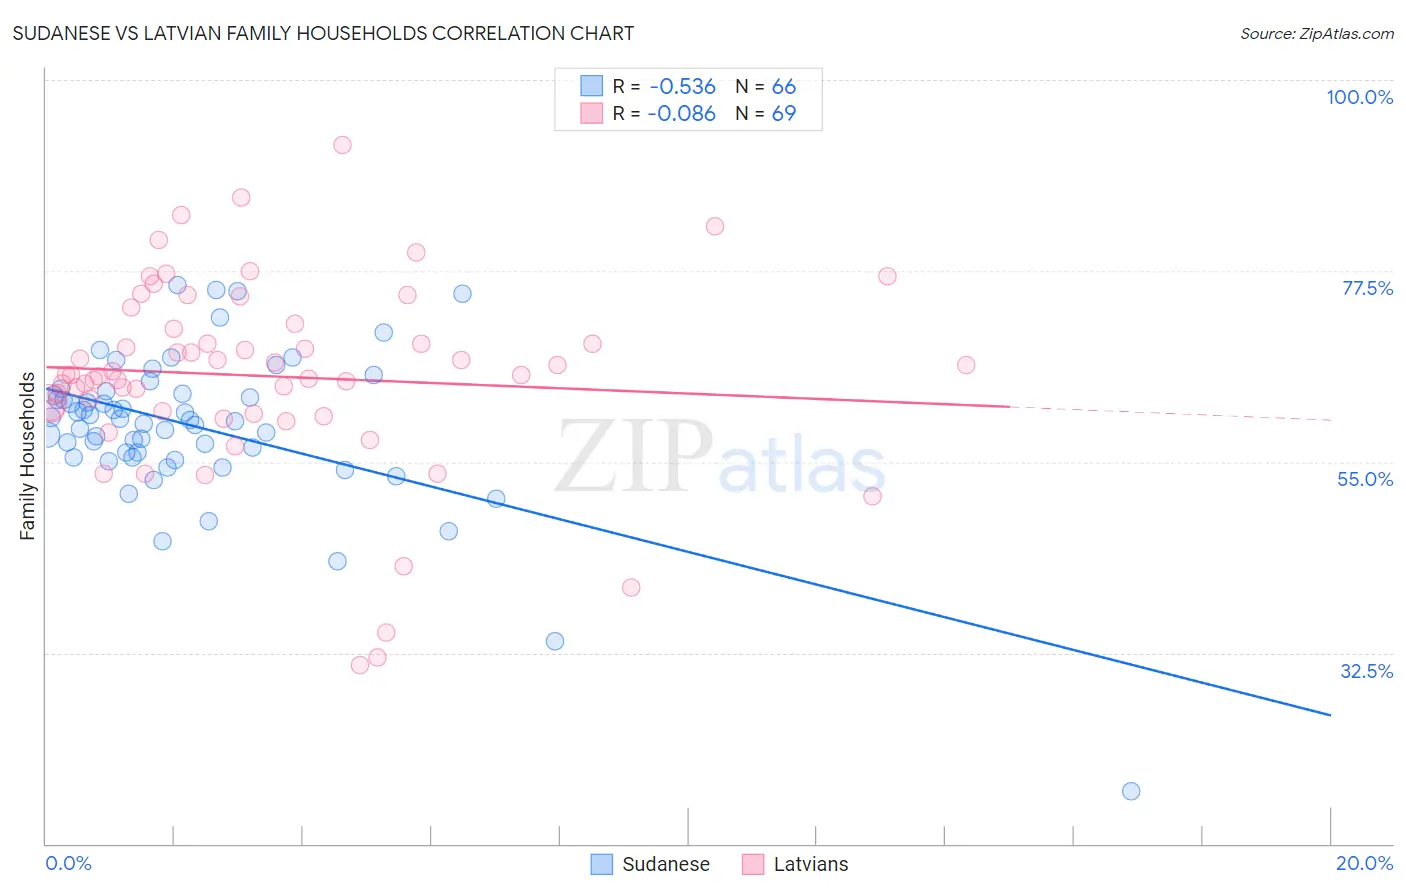
Sudanese vs Latvian Family Households Correlation Chart
The statistical analysis conducted on geographies consisting of 110,109,646 people shows a substantial negative correlation between the proportion of Sudanese and percentage of family households in the United States with a correlation coefficient (R) of -0.536 and weighted average of 60.0%. Similarly, the statistical analysis conducted on geographies consisting of 220,652,081 people shows a slight negative correlation between the proportion of Latvians and percentage of family households in the United States with a correlation coefficient (R) of -0.086 and weighted average of 62.8%, a difference of 4.6%.
Family Households Correlation Summary
| Measurement | Sudanese | Latvian |
| Minimum | 16.3% | 31.0% |
| Maximum | 75.8% | 92.3% |
| Range | 59.6% | 61.3% |
| Mean | 59.1% | 65.1% |
| Median | 59.9% | 65.3% |
| Interquartile 25% (IQ1) | 55.6% | 60.8% |
| Interquartile 75% (IQ3) | 63.0% | 70.9% |
| Interquartile Range (IQR) | 7.4% | 10.1% |
| Standard Deviation (Sample) | 9.2% | 11.5% |
| Standard Deviation (Population) | 9.1% | 11.4% |
Similar Demographics by Family Households
Demographics Similar to Sudanese by Family Households
In terms of family households, the demographic groups most similar to Sudanese are Immigrants from Senegal (60.1%, a difference of 0.18%), Immigrants from Sudan (60.2%, a difference of 0.27%), Senegalese (59.8%, a difference of 0.30%), Immigrants from Saudi Arabia (60.7%, a difference of 1.2%), and Immigrants from Congo (59.2%, a difference of 1.3%).
| Demographics | Rating | Rank | Family Households |
| Immigrants | Ethiopia | 0.0 /100 | #333 | Tragic 61.2% |
| Immigrants | Eastern Africa | 0.0 /100 | #334 | Tragic 61.1% |
| Carpatho Rusyns | 0.0 /100 | #335 | Tragic 61.1% |
| German Russians | 0.0 /100 | #336 | Tragic 60.9% |
| Soviet Union | 0.0 /100 | #337 | Tragic 60.9% |
| Immigrants | Eritrea | 0.0 /100 | #338 | Tragic 60.8% |
| Immigrants | Saudi Arabia | 0.0 /100 | #339 | Tragic 60.7% |
| Immigrants | Sudan | 0.0 /100 | #340 | Tragic 60.2% |
| Immigrants | Senegal | 0.0 /100 | #341 | Tragic 60.1% |
| Sudanese | 0.0 /100 | #342 | Tragic 60.0% |
| Senegalese | 0.0 /100 | #343 | Tragic 59.8% |
| Immigrants | Congo | 0.0 /100 | #344 | Tragic 59.2% |
| Immigrants | Zaire | 0.0 /100 | #345 | Tragic 59.2% |
| Somalis | 0.0 /100 | #346 | Tragic 57.6% |
| Immigrants | Somalia | 0.0 /100 | #347 | Tragic 56.7% |
Demographics Similar to Latvians by Family Households
In terms of family households, the demographic groups most similar to Latvians are British West Indian (62.8%, a difference of 0.0%), Immigrants from Uganda (62.7%, a difference of 0.020%), Mongolian (62.8%, a difference of 0.030%), Immigrants from Nepal (62.7%, a difference of 0.11%), and Australian (62.8%, a difference of 0.14%).
| Demographics | Rating | Rank | Family Households |
| Immigrants | Bulgaria | 0.2 /100 | #280 | Tragic 63.0% |
| Estonians | 0.2 /100 | #281 | Tragic 62.9% |
| New Zealanders | 0.1 /100 | #282 | Tragic 62.9% |
| Immigrants | Denmark | 0.1 /100 | #283 | Tragic 62.9% |
| Australians | 0.1 /100 | #284 | Tragic 62.8% |
| Mongolians | 0.1 /100 | #285 | Tragic 62.8% |
| British West Indians | 0.1 /100 | #286 | Tragic 62.8% |
| Latvians | 0.1 /100 | #287 | Tragic 62.8% |
| Immigrants | Uganda | 0.1 /100 | #288 | Tragic 62.7% |
| Immigrants | Nepal | 0.1 /100 | #289 | Tragic 62.7% |
| Immigrants | Grenada | 0.0 /100 | #290 | Tragic 62.6% |
| U.S. Virgin Islanders | 0.0 /100 | #291 | Tragic 62.6% |
| Immigrants | Burma/Myanmar | 0.0 /100 | #292 | Tragic 62.6% |
| Immigrants | Sweden | 0.0 /100 | #293 | Tragic 62.5% |
| Barbadians | 0.0 /100 | #294 | Tragic 62.5% |