Spaniard vs Uruguayan Median Female Earnings
COMPARE
Spaniard
Uruguayan
Median Female Earnings
Median Female Earnings Comparison
Spaniards
Uruguayans
$38,656
MEDIAN FEMALE EARNINGS
10.3/ 100
METRIC RATING
215th/ 347
METRIC RANK
$39,228
MEDIAN FEMALE EARNINGS
27.3/ 100
METRIC RATING
195th/ 347
METRIC RANK
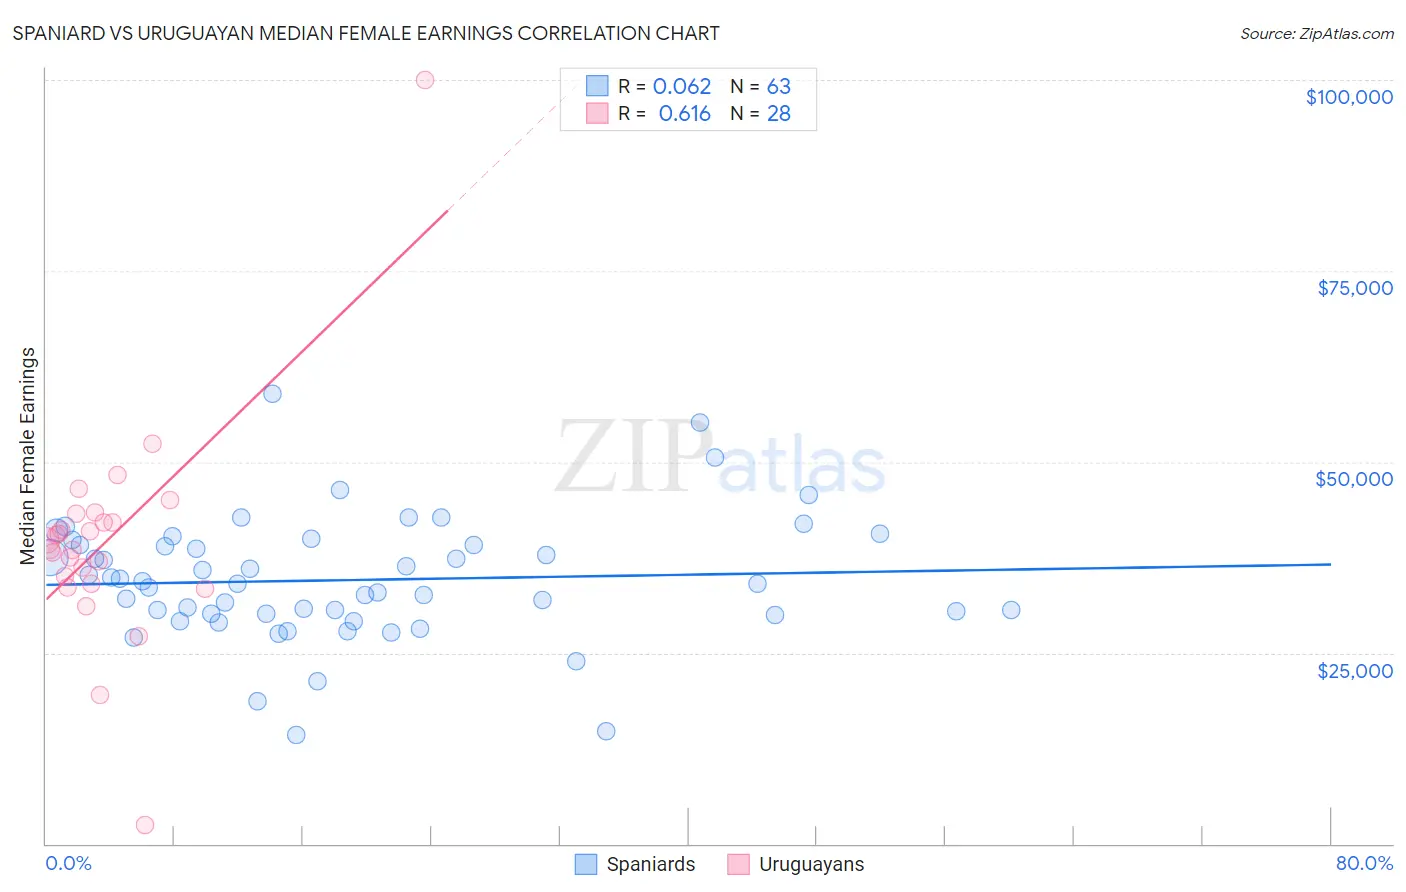
Spaniard vs Uruguayan Median Female Earnings Correlation Chart
The statistical analysis conducted on geographies consisting of 443,223,610 people shows a slight positive correlation between the proportion of Spaniards and median female earnings in the United States with a correlation coefficient (R) of 0.062 and weighted average of $38,656. Similarly, the statistical analysis conducted on geographies consisting of 144,779,017 people shows a significant positive correlation between the proportion of Uruguayans and median female earnings in the United States with a correlation coefficient (R) of 0.616 and weighted average of $39,228, a difference of 1.5%.
Median Female Earnings Correlation Summary
| Measurement | Spaniard | Uruguayan |
| Minimum | $14,192 | $2,499 |
| Maximum | $58,909 | $100,000 |
| Range | $44,717 | $97,501 |
| Mean | $34,527 | $39,566 |
| Median | $34,038 | $39,168 |
| Interquartile 25% (IQ1) | $30,169 | $34,578 |
| Interquartile 75% (IQ3) | $39,139 | $42,658 |
| Interquartile Range (IQR) | $8,970 | $8,081 |
| Standard Deviation (Sample) | $8,078 | $15,119 |
| Standard Deviation (Population) | $8,014 | $14,847 |
Demographics Similar to Spaniards and Uruguayans by Median Female Earnings
In terms of median female earnings, the demographic groups most similar to Spaniards are Iraqi ($38,666, a difference of 0.020%), Jamaican ($38,670, a difference of 0.030%), Aleut ($38,719, a difference of 0.16%), Guamanian/Chamorro ($38,717, a difference of 0.16%), and Czechoslovakian ($38,738, a difference of 0.21%). Similarly, the demographic groups most similar to Uruguayans are Immigrants from Costa Rica ($39,186, a difference of 0.11%), Assyrian/Chaldean/Syriac ($39,159, a difference of 0.17%), Ecuadorian ($39,117, a difference of 0.28%), Icelander ($39,109, a difference of 0.30%), and Immigrants from Panama ($39,049, a difference of 0.46%).
| Demographics | Rating | Rank | Median Female Earnings |
| Uruguayans | 27.3 /100 | #195 | Fair $39,228 |
| Immigrants | Costa Rica | 25.6 /100 | #196 | Fair $39,186 |
| Assyrians/Chaldeans/Syriacs | 24.6 /100 | #197 | Fair $39,159 |
| Ecuadorians | 23.0 /100 | #198 | Fair $39,117 |
| Icelanders | 22.7 /100 | #199 | Fair $39,109 |
| Immigrants | Panama | 20.6 /100 | #200 | Fair $39,049 |
| Panamanians | 20.6 /100 | #201 | Fair $39,049 |
| Slovaks | 19.9 /100 | #202 | Poor $39,029 |
| Czechs | 18.7 /100 | #203 | Poor $38,992 |
| Immigrants | Uruguay | 17.3 /100 | #204 | Poor $38,945 |
| Immigrants | Colombia | 16.3 /100 | #205 | Poor $38,913 |
| Immigrants | Bosnia and Herzegovina | 15.6 /100 | #206 | Poor $38,886 |
| Immigrants | Cambodia | 14.2 /100 | #207 | Poor $38,833 |
| Immigrants | Thailand | 13.6 /100 | #208 | Poor $38,810 |
| Norwegians | 13.4 /100 | #209 | Poor $38,802 |
| Czechoslovakians | 12.0 /100 | #210 | Poor $38,738 |
| Aleuts | 11.6 /100 | #211 | Poor $38,719 |
| Guamanians/Chamorros | 11.5 /100 | #212 | Poor $38,717 |
| Jamaicans | 10.5 /100 | #213 | Poor $38,670 |
| Iraqis | 10.5 /100 | #214 | Poor $38,666 |
| Spaniards | 10.3 /100 | #215 | Poor $38,656 |