Spaniard vs Cuban Median Female Earnings
COMPARE
Spaniard
Cuban
Median Female Earnings
Median Female Earnings Comparison
Spaniards
Cubans
$38,656
MEDIAN FEMALE EARNINGS
10.3/ 100
METRIC RATING
215th/ 347
METRIC RANK
$34,942
MEDIAN FEMALE EARNINGS
0.0/ 100
METRIC RATING
313th/ 347
METRIC RANK
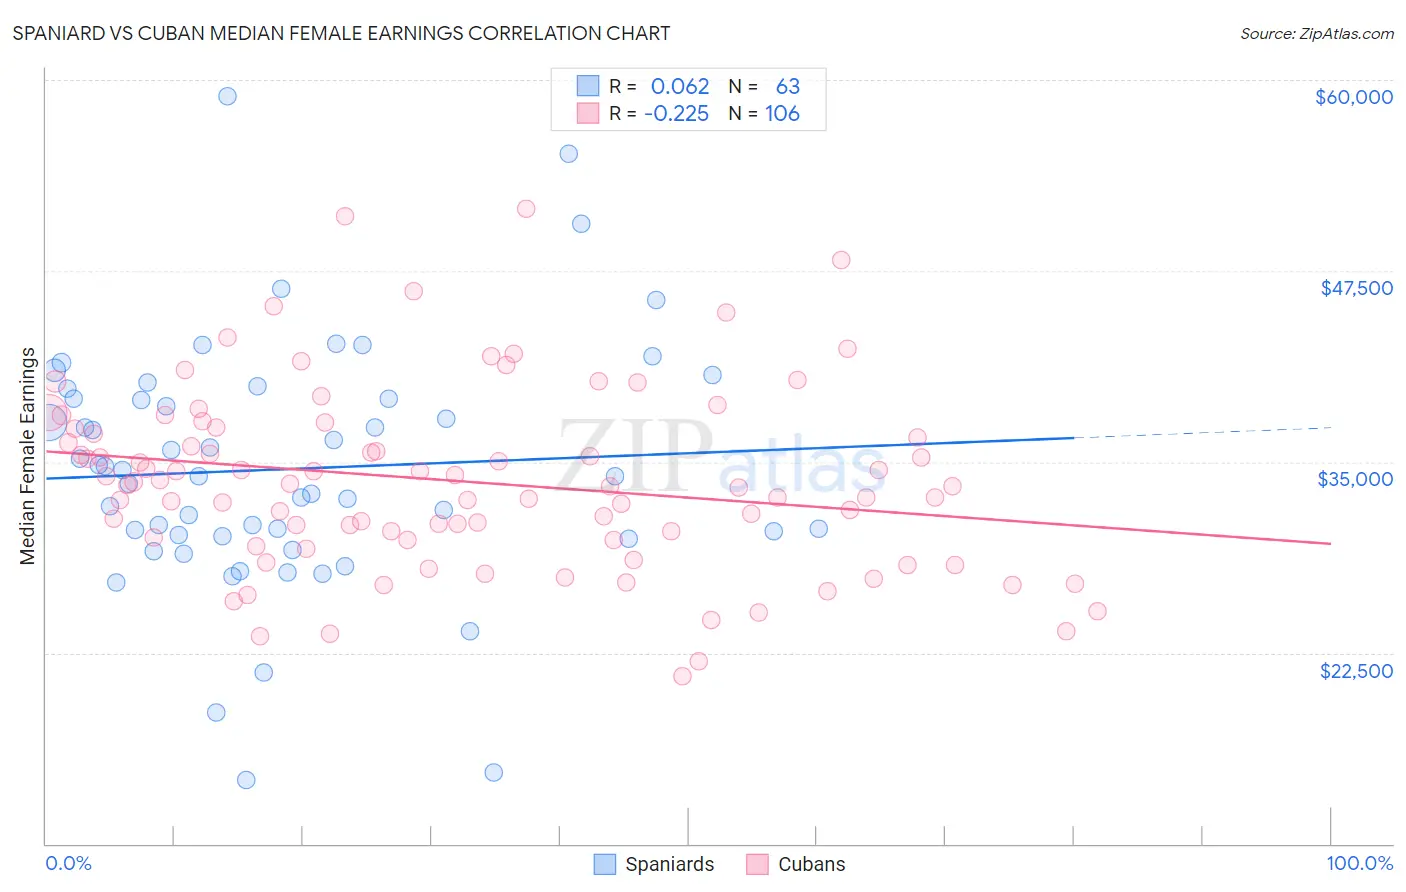
Spaniard vs Cuban Median Female Earnings Correlation Chart
The statistical analysis conducted on geographies consisting of 443,223,610 people shows a slight positive correlation between the proportion of Spaniards and median female earnings in the United States with a correlation coefficient (R) of 0.062 and weighted average of $38,656. Similarly, the statistical analysis conducted on geographies consisting of 449,056,362 people shows a weak negative correlation between the proportion of Cubans and median female earnings in the United States with a correlation coefficient (R) of -0.225 and weighted average of $34,942, a difference of 10.6%.
Median Female Earnings Correlation Summary
| Measurement | Spaniard | Cuban |
| Minimum | $14,192 | $20,938 |
| Maximum | $58,909 | $51,542 |
| Range | $44,717 | $30,604 |
| Mean | $34,527 | $33,741 |
| Median | $34,038 | $33,424 |
| Interquartile 25% (IQ1) | $30,169 | $29,890 |
| Interquartile 75% (IQ3) | $39,139 | $37,174 |
| Interquartile Range (IQR) | $8,970 | $7,284 |
| Standard Deviation (Sample) | $8,078 | $5,986 |
| Standard Deviation (Population) | $8,014 | $5,958 |
Similar Demographics by Median Female Earnings
Demographics Similar to Spaniards by Median Female Earnings
In terms of median female earnings, the demographic groups most similar to Spaniards are Iraqi ($38,666, a difference of 0.020%), Jamaican ($38,670, a difference of 0.030%), Immigrants from Ecuador ($38,644, a difference of 0.030%), Immigrants from Jamaica ($38,625, a difference of 0.080%), and Cape Verdean ($38,614, a difference of 0.11%).
| Demographics | Rating | Rank | Median Female Earnings |
| Immigrants | Thailand | 13.6 /100 | #208 | Poor $38,810 |
| Norwegians | 13.4 /100 | #209 | Poor $38,802 |
| Czechoslovakians | 12.0 /100 | #210 | Poor $38,738 |
| Aleuts | 11.6 /100 | #211 | Poor $38,719 |
| Guamanians/Chamorros | 11.5 /100 | #212 | Poor $38,717 |
| Jamaicans | 10.5 /100 | #213 | Poor $38,670 |
| Iraqis | 10.5 /100 | #214 | Poor $38,666 |
| Spaniards | 10.3 /100 | #215 | Poor $38,656 |
| Immigrants | Ecuador | 10.1 /100 | #216 | Poor $38,644 |
| Immigrants | Jamaica | 9.7 /100 | #217 | Tragic $38,625 |
| Cape Verdeans | 9.5 /100 | #218 | Tragic $38,614 |
| Nepalese | 9.3 /100 | #219 | Tragic $38,603 |
| Yugoslavians | 8.8 /100 | #220 | Tragic $38,573 |
| Immigrants | Azores | 8.8 /100 | #221 | Tragic $38,573 |
| Japanese | 8.1 /100 | #222 | Tragic $38,528 |
Demographics Similar to Cubans by Median Female Earnings
In terms of median female earnings, the demographic groups most similar to Cubans are Yaqui ($34,943, a difference of 0.0%), Ute ($34,960, a difference of 0.050%), Apache ($34,895, a difference of 0.13%), Chippewa ($35,003, a difference of 0.17%), and Honduran ($35,013, a difference of 0.20%).
| Demographics | Rating | Rank | Median Female Earnings |
| Fijians | 0.0 /100 | #306 | Tragic $35,114 |
| Sioux | 0.0 /100 | #307 | Tragic $35,063 |
| Immigrants | Bahamas | 0.0 /100 | #308 | Tragic $35,027 |
| Hondurans | 0.0 /100 | #309 | Tragic $35,013 |
| Chippewa | 0.0 /100 | #310 | Tragic $35,003 |
| Ute | 0.0 /100 | #311 | Tragic $34,960 |
| Yaqui | 0.0 /100 | #312 | Tragic $34,943 |
| Cubans | 0.0 /100 | #313 | Tragic $34,942 |
| Apache | 0.0 /100 | #314 | Tragic $34,895 |
| Pennsylvania Germans | 0.0 /100 | #315 | Tragic $34,802 |
| Cherokee | 0.0 /100 | #316 | Tragic $34,742 |
| Potawatomi | 0.0 /100 | #317 | Tragic $34,739 |
| Immigrants | Yemen | 0.0 /100 | #318 | Tragic $34,693 |
| Shoshone | 0.0 /100 | #319 | Tragic $34,677 |
| Immigrants | Honduras | 0.0 /100 | #320 | Tragic $34,647 |