Spaniard vs Lebanese Median Female Earnings
COMPARE
Spaniard
Lebanese
Median Female Earnings
Median Female Earnings Comparison
Spaniards
Lebanese
$38,656
MEDIAN FEMALE EARNINGS
10.3/ 100
METRIC RATING
215th/ 347
METRIC RANK
$40,006
MEDIAN FEMALE EARNINGS
65.5/ 100
METRIC RATING
163rd/ 347
METRIC RANK
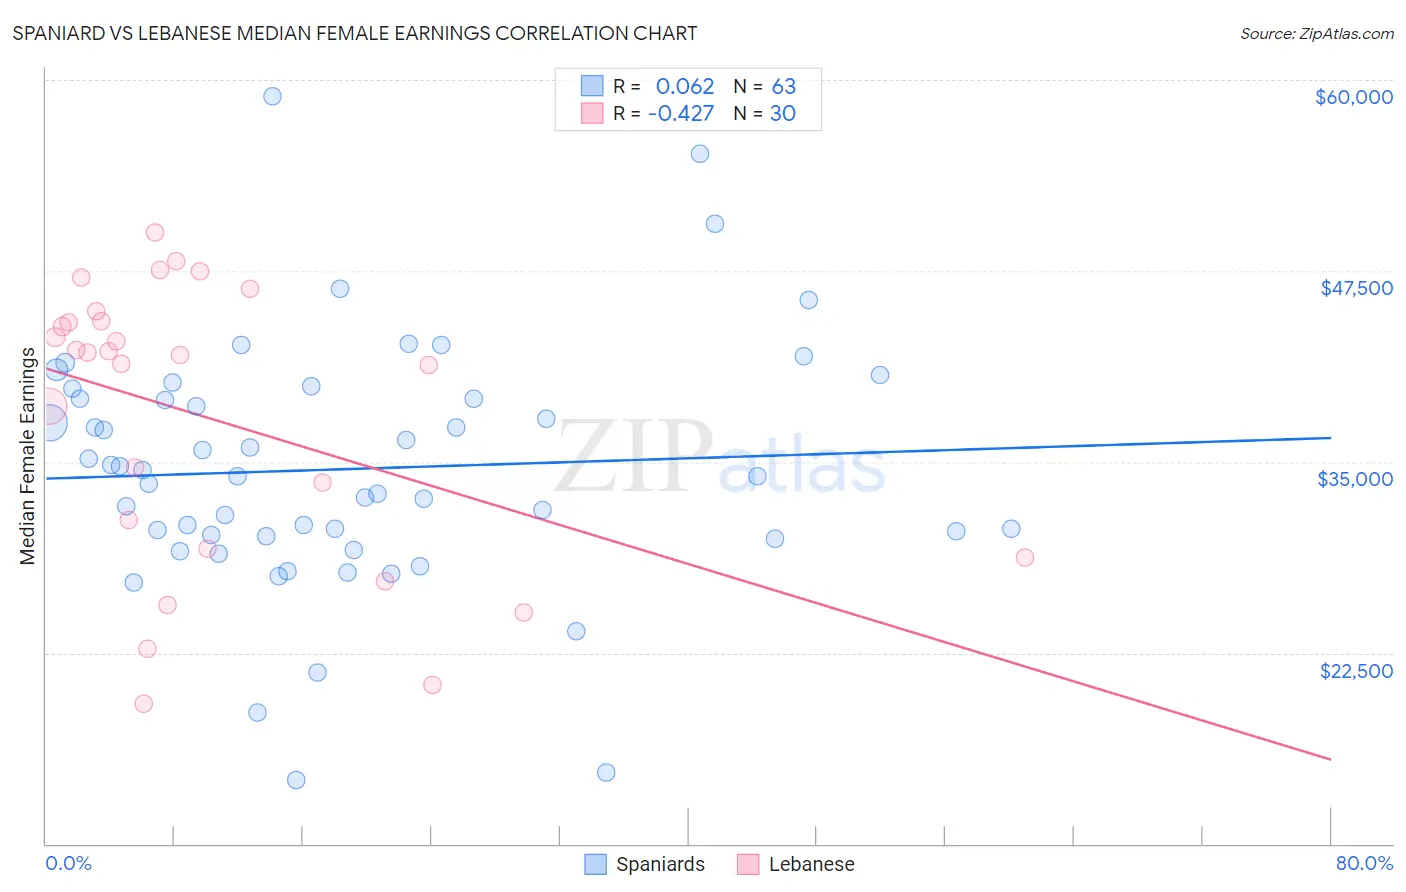
Spaniard vs Lebanese Median Female Earnings Correlation Chart
The statistical analysis conducted on geographies consisting of 443,223,610 people shows a slight positive correlation between the proportion of Spaniards and median female earnings in the United States with a correlation coefficient (R) of 0.062 and weighted average of $38,656. Similarly, the statistical analysis conducted on geographies consisting of 401,457,722 people shows a moderate negative correlation between the proportion of Lebanese and median female earnings in the United States with a correlation coefficient (R) of -0.427 and weighted average of $40,006, a difference of 3.5%.
Median Female Earnings Correlation Summary
| Measurement | Spaniard | Lebanese |
| Minimum | $14,192 | $19,128 |
| Maximum | $58,909 | $50,050 |
| Range | $44,717 | $30,922 |
| Mean | $34,527 | $37,921 |
| Median | $34,038 | $42,088 |
| Interquartile 25% (IQ1) | $30,169 | $29,289 |
| Interquartile 75% (IQ3) | $39,139 | $44,167 |
| Interquartile Range (IQR) | $8,970 | $14,878 |
| Standard Deviation (Sample) | $8,078 | $9,199 |
| Standard Deviation (Population) | $8,014 | $9,044 |
Similar Demographics by Median Female Earnings
Demographics Similar to Spaniards by Median Female Earnings
In terms of median female earnings, the demographic groups most similar to Spaniards are Iraqi ($38,666, a difference of 0.020%), Jamaican ($38,670, a difference of 0.030%), Immigrants from Ecuador ($38,644, a difference of 0.030%), Immigrants from Jamaica ($38,625, a difference of 0.080%), and Cape Verdean ($38,614, a difference of 0.11%).
| Demographics | Rating | Rank | Median Female Earnings |
| Immigrants | Thailand | 13.6 /100 | #208 | Poor $38,810 |
| Norwegians | 13.4 /100 | #209 | Poor $38,802 |
| Czechoslovakians | 12.0 /100 | #210 | Poor $38,738 |
| Aleuts | 11.6 /100 | #211 | Poor $38,719 |
| Guamanians/Chamorros | 11.5 /100 | #212 | Poor $38,717 |
| Jamaicans | 10.5 /100 | #213 | Poor $38,670 |
| Iraqis | 10.5 /100 | #214 | Poor $38,666 |
| Spaniards | 10.3 /100 | #215 | Poor $38,656 |
| Immigrants | Ecuador | 10.1 /100 | #216 | Poor $38,644 |
| Immigrants | Jamaica | 9.7 /100 | #217 | Tragic $38,625 |
| Cape Verdeans | 9.5 /100 | #218 | Tragic $38,614 |
| Nepalese | 9.3 /100 | #219 | Tragic $38,603 |
| Yugoslavians | 8.8 /100 | #220 | Tragic $38,573 |
| Immigrants | Azores | 8.8 /100 | #221 | Tragic $38,573 |
| Japanese | 8.1 /100 | #222 | Tragic $38,528 |
Demographics Similar to Lebanese by Median Female Earnings
In terms of median female earnings, the demographic groups most similar to Lebanese are South American Indian ($40,019, a difference of 0.030%), Alsatian ($40,060, a difference of 0.14%), Immigrants from Saudi Arabia ($39,952, a difference of 0.14%), Inupiat ($40,080, a difference of 0.18%), and Immigrants from Bangladesh ($39,910, a difference of 0.24%).
| Demographics | Rating | Rank | Median Female Earnings |
| Peruvians | 75.3 /100 | #156 | Good $40,234 |
| Portuguese | 73.0 /100 | #157 | Good $40,177 |
| Immigrants | Senegal | 72.2 /100 | #158 | Good $40,157 |
| Immigrants | Vietnam | 72.0 /100 | #159 | Good $40,153 |
| Inupiat | 68.9 /100 | #160 | Good $40,080 |
| Alsatians | 68.0 /100 | #161 | Good $40,060 |
| South American Indians | 66.1 /100 | #162 | Good $40,019 |
| Lebanese | 65.5 /100 | #163 | Good $40,006 |
| Immigrants | Saudi Arabia | 62.9 /100 | #164 | Good $39,952 |
| Immigrants | Bangladesh | 60.8 /100 | #165 | Good $39,910 |
| Immigrants | Ghana | 60.0 /100 | #166 | Good $39,894 |
| Luxembourgers | 59.9 /100 | #167 | Average $39,891 |
| Immigrants | Peru | 58.9 /100 | #168 | Average $39,871 |
| Kenyans | 58.4 /100 | #169 | Average $39,860 |
| Slovenes | 56.2 /100 | #170 | Average $39,817 |