Immigrants from South America vs Uruguayan Median Female Earnings
COMPARE
Immigrants from South America
Uruguayan
Median Female Earnings
Median Female Earnings Comparison
Immigrants from South America
Uruguayans
$39,643
MEDIAN FEMALE EARNINGS
47.2/ 100
METRIC RATING
175th/ 347
METRIC RANK
$39,228
MEDIAN FEMALE EARNINGS
27.3/ 100
METRIC RATING
195th/ 347
METRIC RANK
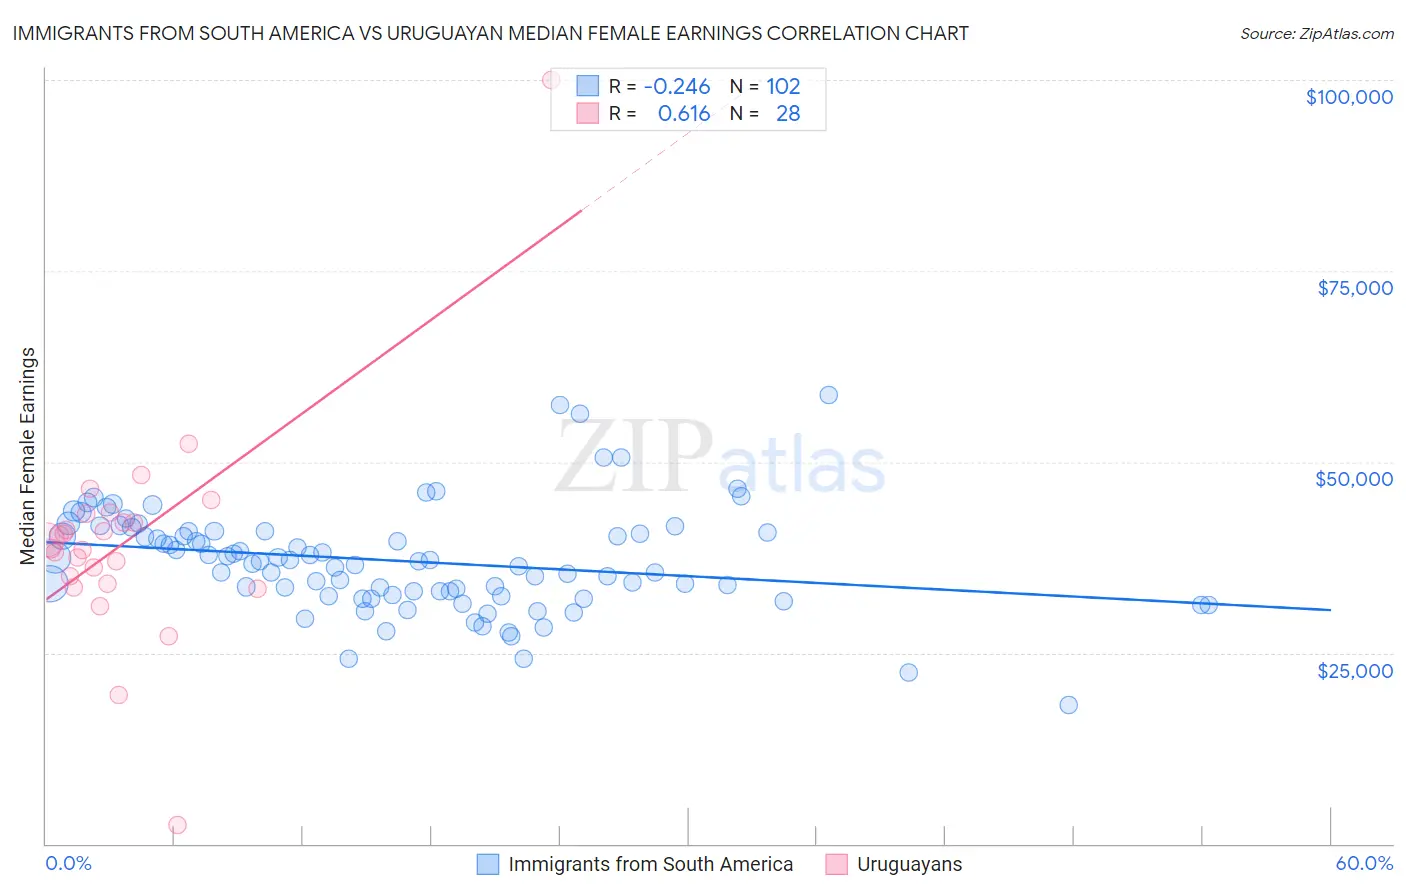
Immigrants from South America vs Uruguayan Median Female Earnings Correlation Chart
The statistical analysis conducted on geographies consisting of 486,047,092 people shows a weak negative correlation between the proportion of Immigrants from South America and median female earnings in the United States with a correlation coefficient (R) of -0.246 and weighted average of $39,643. Similarly, the statistical analysis conducted on geographies consisting of 144,779,017 people shows a significant positive correlation between the proportion of Uruguayans and median female earnings in the United States with a correlation coefficient (R) of 0.616 and weighted average of $39,228, a difference of 1.1%.
Median Female Earnings Correlation Summary
| Measurement | Immigrants from South America | Uruguayan |
| Minimum | $18,150 | $2,499 |
| Maximum | $58,709 | $100,000 |
| Range | $40,559 | $97,501 |
| Mean | $37,049 | $39,566 |
| Median | $37,037 | $39,168 |
| Interquartile 25% (IQ1) | $32,572 | $34,578 |
| Interquartile 75% (IQ3) | $40,849 | $42,658 |
| Interquartile Range (IQR) | $8,277 | $8,081 |
| Standard Deviation (Sample) | $6,851 | $15,119 |
| Standard Deviation (Population) | $6,817 | $14,847 |
Demographics Similar to Immigrants from South America and Uruguayans by Median Female Earnings
In terms of median female earnings, the demographic groups most similar to Immigrants from South America are Nigerian ($39,641, a difference of 0.010%), Costa Rican ($39,622, a difference of 0.050%), Slavic ($39,613, a difference of 0.080%), Immigrants from Germany ($39,603, a difference of 0.10%), and Immigrants from Kenya ($39,535, a difference of 0.27%). Similarly, the demographic groups most similar to Uruguayans are Irish ($39,291, a difference of 0.16%), Immigrants from Nigeria ($39,294, a difference of 0.17%), Immigrants ($39,328, a difference of 0.26%), Immigrants from Western Africa ($39,351, a difference of 0.31%), and Puget Sound Salish ($39,376, a difference of 0.38%).
| Demographics | Rating | Rank | Median Female Earnings |
| Immigrants | South America | 47.2 /100 | #175 | Average $39,643 |
| Nigerians | 47.0 /100 | #176 | Average $39,641 |
| Costa Ricans | 46.1 /100 | #177 | Average $39,622 |
| Slavs | 45.6 /100 | #178 | Average $39,613 |
| Immigrants | Germany | 45.1 /100 | #179 | Average $39,603 |
| Immigrants | Kenya | 41.6 /100 | #180 | Average $39,535 |
| Tsimshian | 41.4 /100 | #181 | Average $39,530 |
| Tlingit-Haida | 40.5 /100 | #182 | Average $39,513 |
| Hungarians | 40.3 /100 | #183 | Average $39,510 |
| Europeans | 37.7 /100 | #184 | Fair $39,457 |
| Immigrants | West Indies | 36.9 /100 | #185 | Fair $39,441 |
| Colombians | 36.9 /100 | #186 | Fair $39,439 |
| Swedes | 36.0 /100 | #187 | Fair $39,421 |
| Bermudans | 35.9 /100 | #188 | Fair $39,418 |
| Senegalese | 34.2 /100 | #189 | Fair $39,384 |
| Puget Sound Salish | 33.9 /100 | #190 | Fair $39,376 |
| Immigrants | Western Africa | 32.7 /100 | #191 | Fair $39,351 |
| Immigrants | Immigrants | 31.7 /100 | #192 | Fair $39,328 |
| Immigrants | Nigeria | 30.2 /100 | #193 | Fair $39,294 |
| Irish | 30.0 /100 | #194 | Fair $39,291 |
| Uruguayans | 27.3 /100 | #195 | Fair $39,228 |