Comanche vs Uruguayan Median Female Earnings
COMPARE
Comanche
Uruguayan
Median Female Earnings
Median Female Earnings Comparison
Comanche
Uruguayans
$35,661
MEDIAN FEMALE EARNINGS
0.0/ 100
METRIC RATING
295th/ 347
METRIC RANK
$39,228
MEDIAN FEMALE EARNINGS
27.3/ 100
METRIC RATING
195th/ 347
METRIC RANK
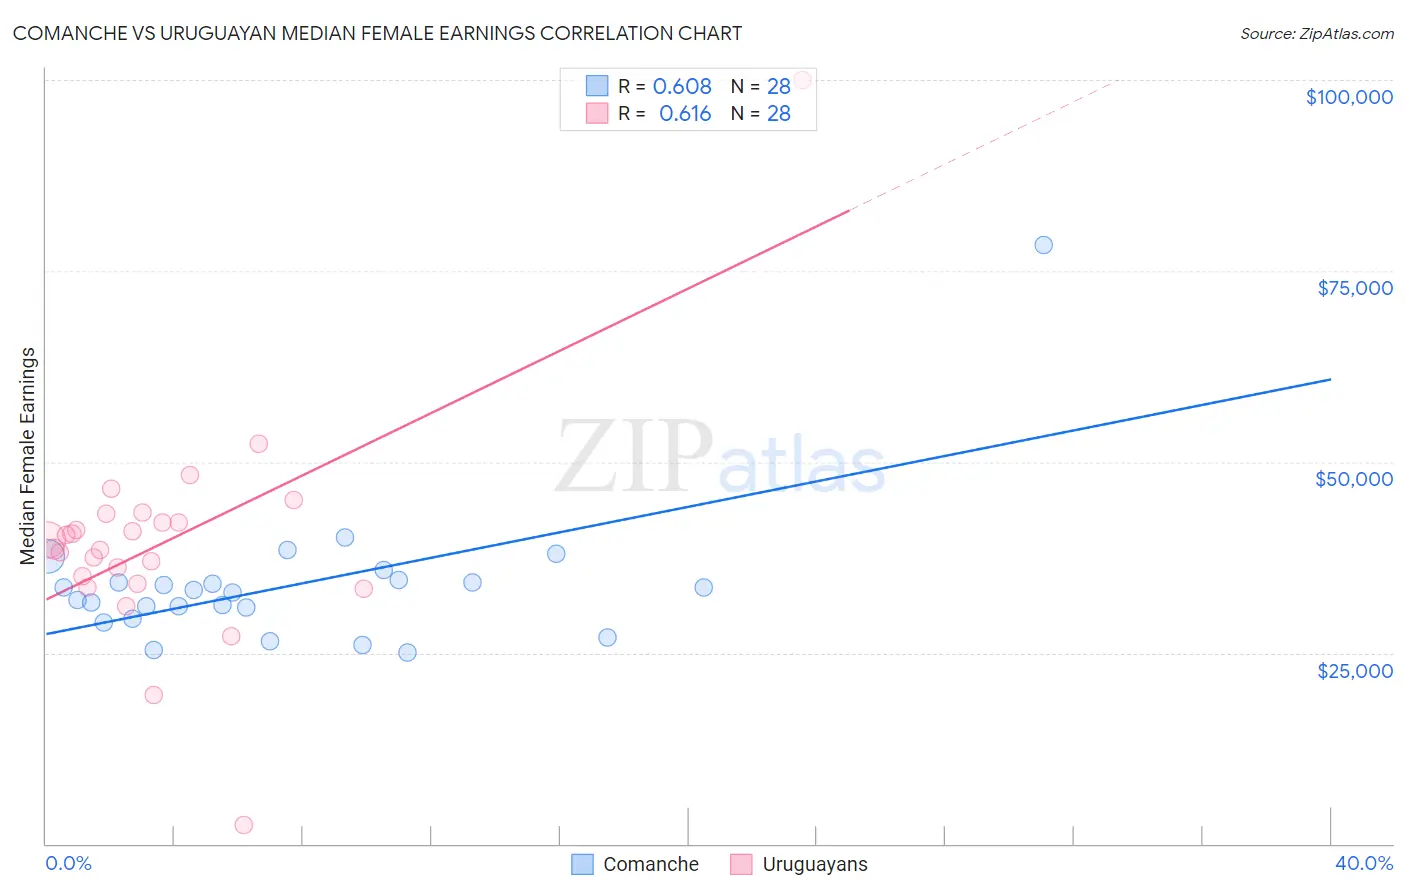
Comanche vs Uruguayan Median Female Earnings Correlation Chart
The statistical analysis conducted on geographies consisting of 109,756,357 people shows a significant positive correlation between the proportion of Comanche and median female earnings in the United States with a correlation coefficient (R) of 0.608 and weighted average of $35,661. Similarly, the statistical analysis conducted on geographies consisting of 144,779,017 people shows a significant positive correlation between the proportion of Uruguayans and median female earnings in the United States with a correlation coefficient (R) of 0.616 and weighted average of $39,228, a difference of 10.0%.
Median Female Earnings Correlation Summary
| Measurement | Comanche | Uruguayan |
| Minimum | $25,100 | $2,499 |
| Maximum | $78,452 | $100,000 |
| Range | $53,352 | $97,501 |
| Mean | $33,877 | $39,566 |
| Median | $33,076 | $39,168 |
| Interquartile 25% (IQ1) | $30,131 | $34,578 |
| Interquartile 75% (IQ3) | $34,372 | $42,658 |
| Interquartile Range (IQR) | $4,241 | $8,081 |
| Standard Deviation (Sample) | $9,585 | $15,119 |
| Standard Deviation (Population) | $9,413 | $14,847 |
Similar Demographics by Median Female Earnings
Demographics Similar to Comanche by Median Female Earnings
In terms of median female earnings, the demographic groups most similar to Comanche are Cheyenne ($35,673, a difference of 0.030%), Guatemalan ($35,695, a difference of 0.090%), Mexican American Indian ($35,629, a difference of 0.090%), American ($35,777, a difference of 0.32%), and Hmong ($35,498, a difference of 0.46%).
| Demographics | Rating | Rank | Median Female Earnings |
| Immigrants | Zaire | 0.0 /100 | #288 | Tragic $36,017 |
| Bangladeshis | 0.0 /100 | #289 | Tragic $35,960 |
| Central American Indians | 0.0 /100 | #290 | Tragic $35,930 |
| Blackfeet | 0.0 /100 | #291 | Tragic $35,864 |
| Americans | 0.0 /100 | #292 | Tragic $35,777 |
| Guatemalans | 0.0 /100 | #293 | Tragic $35,695 |
| Cheyenne | 0.0 /100 | #294 | Tragic $35,673 |
| Comanche | 0.0 /100 | #295 | Tragic $35,661 |
| Mexican American Indians | 0.0 /100 | #296 | Tragic $35,629 |
| Hmong | 0.0 /100 | #297 | Tragic $35,498 |
| Immigrants | Micronesia | 0.0 /100 | #298 | Tragic $35,477 |
| Immigrants | Guatemala | 0.0 /100 | #299 | Tragic $35,444 |
| Yuman | 0.0 /100 | #300 | Tragic $35,377 |
| Pima | 0.0 /100 | #301 | Tragic $35,326 |
| Blacks/African Americans | 0.0 /100 | #302 | Tragic $35,315 |
Demographics Similar to Uruguayans by Median Female Earnings
In terms of median female earnings, the demographic groups most similar to Uruguayans are Immigrants from Costa Rica ($39,186, a difference of 0.11%), Irish ($39,291, a difference of 0.16%), Immigrants from Nigeria ($39,294, a difference of 0.17%), Assyrian/Chaldean/Syriac ($39,159, a difference of 0.17%), and Immigrants ($39,328, a difference of 0.26%).
| Demographics | Rating | Rank | Median Female Earnings |
| Bermudans | 35.9 /100 | #188 | Fair $39,418 |
| Senegalese | 34.2 /100 | #189 | Fair $39,384 |
| Puget Sound Salish | 33.9 /100 | #190 | Fair $39,376 |
| Immigrants | Western Africa | 32.7 /100 | #191 | Fair $39,351 |
| Immigrants | Immigrants | 31.7 /100 | #192 | Fair $39,328 |
| Immigrants | Nigeria | 30.2 /100 | #193 | Fair $39,294 |
| Irish | 30.0 /100 | #194 | Fair $39,291 |
| Uruguayans | 27.3 /100 | #195 | Fair $39,228 |
| Immigrants | Costa Rica | 25.6 /100 | #196 | Fair $39,186 |
| Assyrians/Chaldeans/Syriacs | 24.6 /100 | #197 | Fair $39,159 |
| Ecuadorians | 23.0 /100 | #198 | Fair $39,117 |
| Icelanders | 22.7 /100 | #199 | Fair $39,109 |
| Immigrants | Panama | 20.6 /100 | #200 | Fair $39,049 |
| Panamanians | 20.6 /100 | #201 | Fair $39,049 |
| Slovaks | 19.9 /100 | #202 | Poor $39,029 |